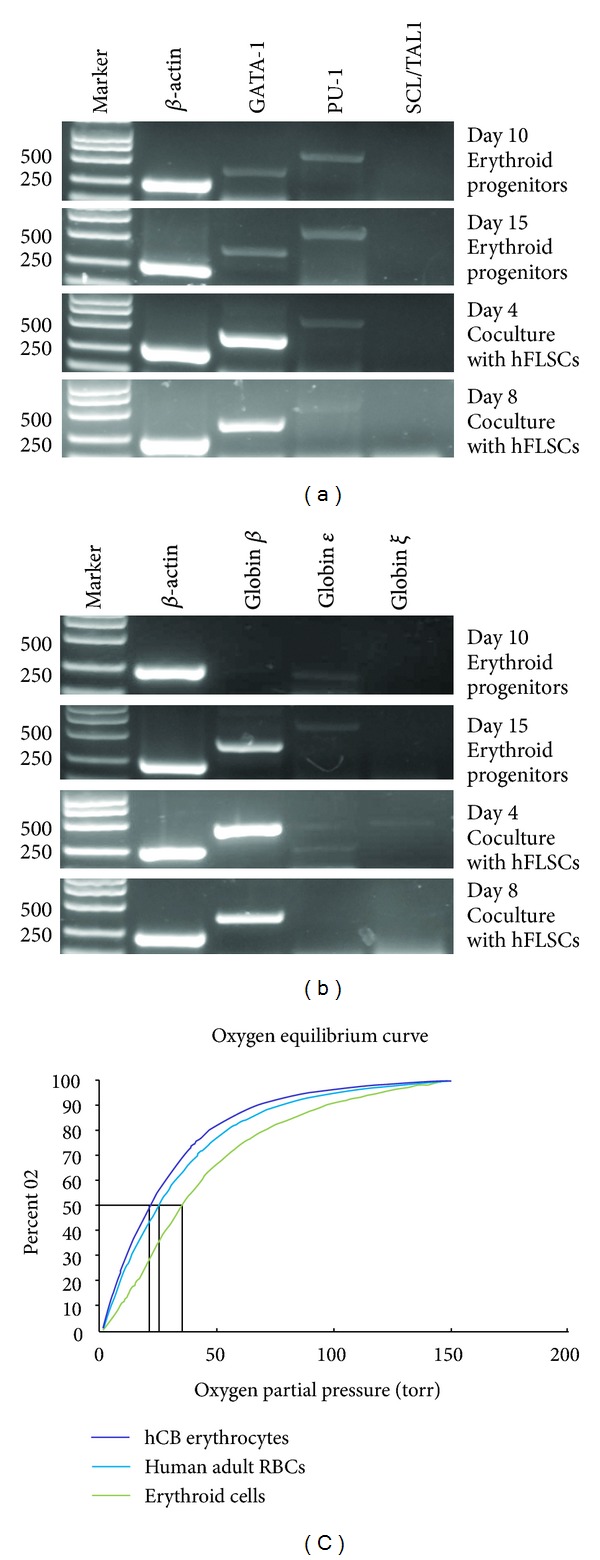
Figure 6.

Characterization of cord blood HSCs-derived red blood cells. (a) RT-PCR analysis for erythroid specific transcriptor gene expression. (b) RT-PCR analysis for globin gene expression. Gene expression was normalized to the internal control, β-actin gene, for each data point. (c) Functional characterization of cord blood HSCs-derived erythroid cells. Oxygen equilibrium curves of normal human adult and cord blood RBCs and cord blood-derived RBCs by coculturing with hFLSCs for 8 days.
