
Figure 2.
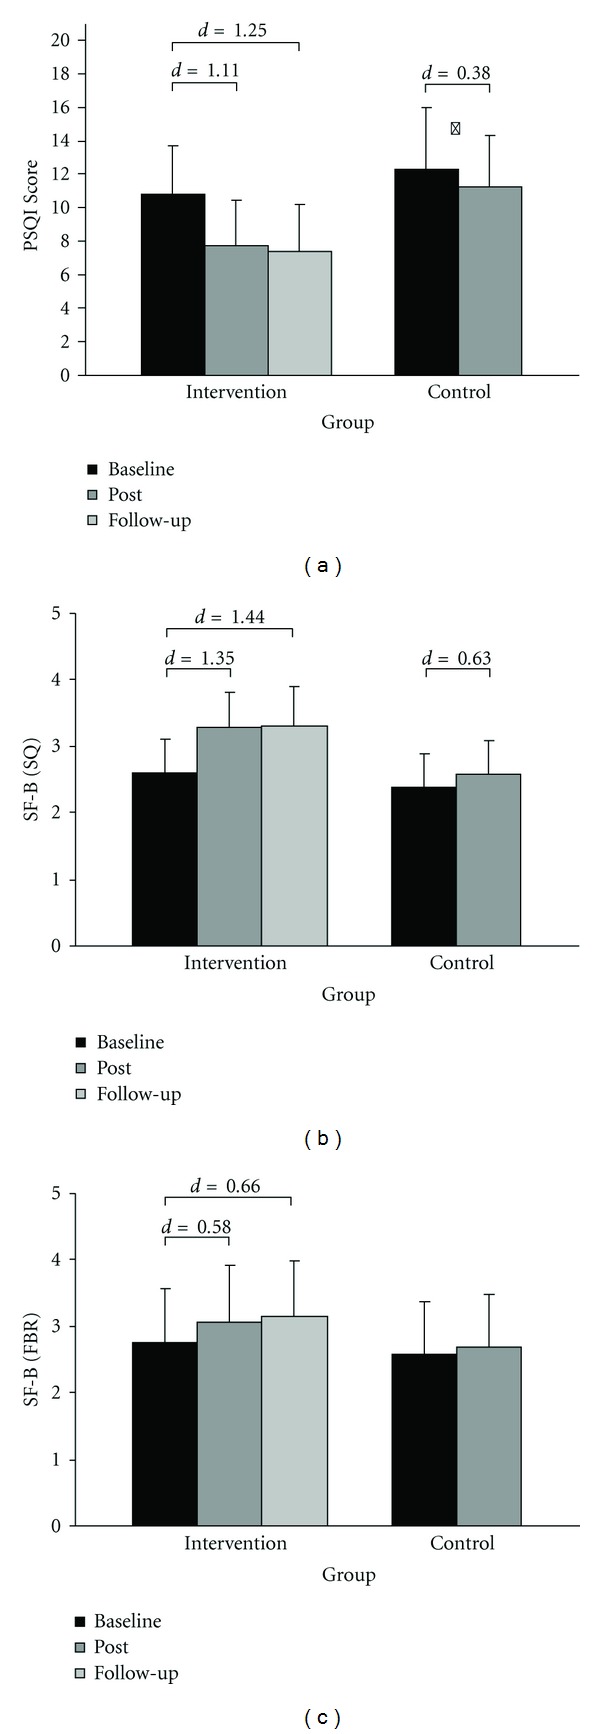
Mean and standard deviations for subjective sleep quality (SQ) and feeling of being refreshed in the morning (FBR) for the intervention and waiting-list control group. Lower rates indicate better sleep (PSQI). Effect sizes (Cohens d) are demonstrated for significant t-tests P < .001, *P = .015.