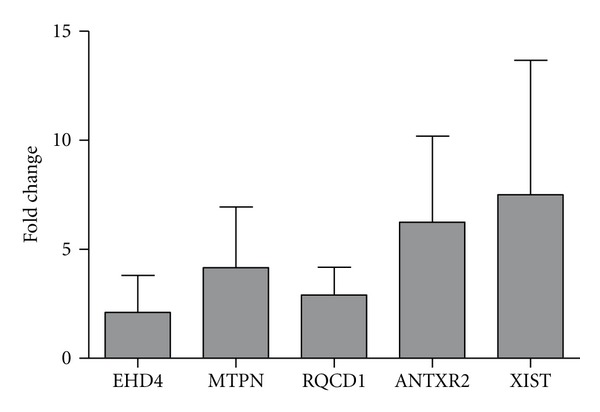
Figure 1.

Gene expression fold-change differences between PBMC from M. bovis 303 and 534 infected cells and control uninfected cells using RT-qPCR. Relative gene expression was calculated using the 2-DDCt method with E correction, using RNA pol II mRNA expression as reference gene and the uninfected cells condition as the calibrator. The bars indicate the average ratios of infected cells/uninfected cells ±SEM.
