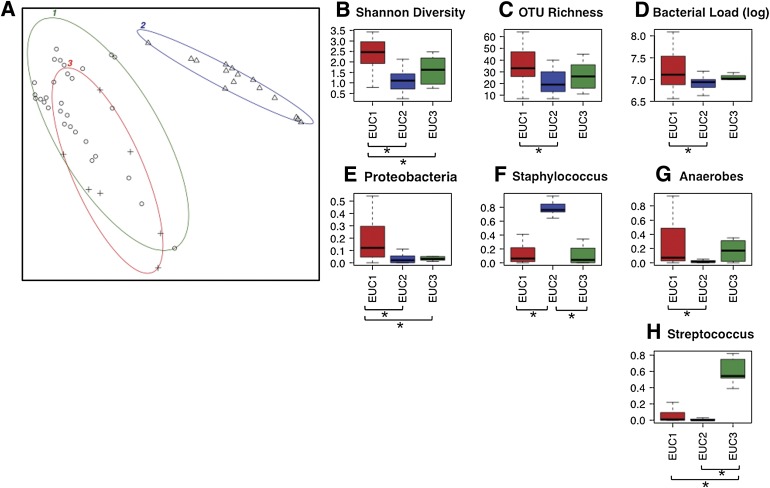
FIG. 3.
Clustering of DFUs according to Euclidean distance of the 72 species-level OTUs present in >10% of DFU samples and containing >100 sequence counts. A: Depicted is clustering of k = 3 medoids on the first two principle components, which together explain 83.19% of the point variability. The three clusters, or EUCs, are highlighted by different color ellipses, and the points within the clusters are represented by different symbols. The silhouette score for the clusters (average width) was 0.42. EUCs differed significantly by Kruskal-Wallis test (P ≤ 0.05) in Shannon diversity (B), OTU richness (C), log bacterial load (D), and relative abundance of Proteobacteria (E), Staphylococcus (F), anaerobic bacteria (G), and Streptococcus (H). Color of boxes in (B–H) correspond to color of ellipse encircling each EUC. B–H: The x-axis labels represent EUC clusters, boxes represent interquartile range, lines within the box depict median, and whiskers represent the lowest and highest values within 1.5-times the interquartile range. *Significantly different pair-wise comparison (P ≤ 0.05) by Wilcoxon rank-sum test.

