FIG. 4.
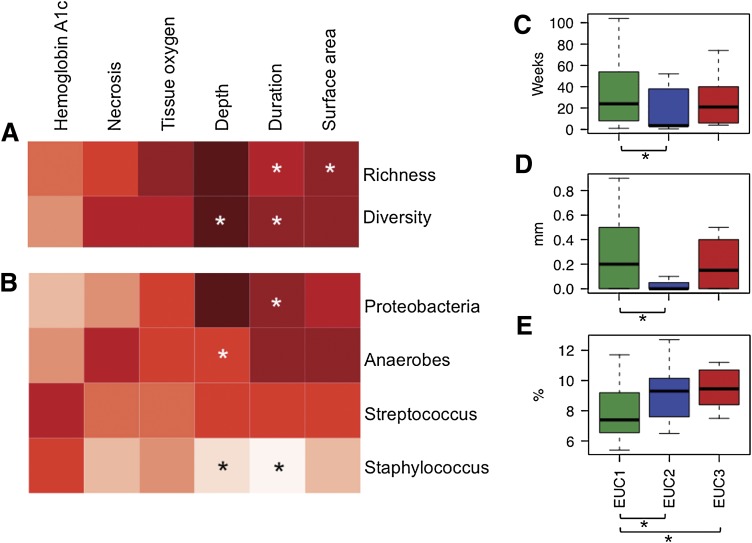
Association of clinical factors with various measures of bioburden. Depicted are (A) bacterial species-level richness and diversity, (B) dominant taxa colonizing DFUs, and (C–E) EUC. A and B: Columns correspond to clinical factors measured in patients with DFU at time of sampling. Spearman rank correlation coefficients are represented by the heat map, with red and white representing positive correlation and negative correlation, respectively. *Significant correlations with P ≤ 0.05. All Spearman correlation coefficient values are listed in Supplementary Table 3. C–E: Box plots of ulcer duration in weeks (C), ulcer depth in millimeters (D), and hemoglobin A1c in percentage (E) plotted against EUC (x-axis). Boxes represent interquartile range, lines within the box depict median, and whiskers represent the lowest and highest values within 1.5-times the interquartile range. Significant associations between EUC and clinical factors by the Kruskal-Wallis test were ulcer depth (D) and hemoglobin A1c (E), whereas ulcer duration only came close to significance (C). C–E: *Significant pair-wise comparisons between EUCs by the Wilcoxon rank-sum test (P ≤ 0.05).

