
FIG. 1.
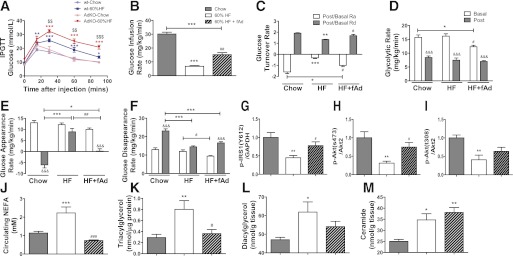
Glucose homeostasis, insulin sensitivity, and related lipid analysis. wt and AdKO mice were fed either commercial chow or 60% HFD diet at the age of 6 weeks for a period of 6 weeks. Intraperitoneal glucose tolerance test (IPGTT) was performed after 5–6 h fasting to assess the effect of 60% HFD on whole-body glucose tolerance. After a 6-week HFD, AdKO mice were injected with either saline or fAd at a dosage of 3 µg/g body wt i.p. twice a day for an additional 2 weeks. Jugular vein and carotid artery catheters were embedded into animals 4 days before the hyperinsulinemic-euglycemic clamp procedure, and clamps were performed on animals after 5–6 h starvation. Blood samples were collected during the clamp procedure, and calculations were made based on the radioactivity readings from serum to represent whole-body glucose metabolism. Skeletal muscle insulin signaling was assessed 5 min after a bolus injection of insulin (4 units/kg body wt) via tail vein. A: IPGTT curves (millimoles per liter). B: Glucose infusion rate (GIR) (milligrams per kilogram per minute). C: Glucose turnover rate (post, after insulin clamp; basal, before insulin clamp). D: Glycolytic rate (milligrams per kilogram per minute). E: Glucose Ra (milligrams per kilogram per minute). F: Glucose Rd (milligrams per kilogram per minute). Quantitative analysis of Western blot detecting. G: Phosphorylated (p)-IRS1(Y612)/ glyceraldehyde-3-phosphate dehydrogenase (GAPDH). H: p-Akt(S473)/Akt2. I: p-Akt(T308)/Akt2. Various indices of lipid metabolism were also assessed and are shown. J: Circulating NEFA (millimoles per liter). K: Muscle triacylglycerol (nanomoles per microgram of protein). L: Muscle DAG (nanomoles per gram of tissue). M: Muscle ceramide (nanomoles per gram of tissue). Data represent means ± SEM. *Significant difference between HFD group and chow diet group. #Significant difference between fAd and saline treatment within the HFD group. $Significant difference between wt and AdKO mice within the HFD group. &Significant difference between before (basal) and after (post) insulin clamp. *#P < 0.05. **##$$P < 0.01. ***###$$$&&&P < 0.001. n = 4–7. HF, high fat. (A high-quality color representation of this figure is available in the online issue.)