
FIG. 2.
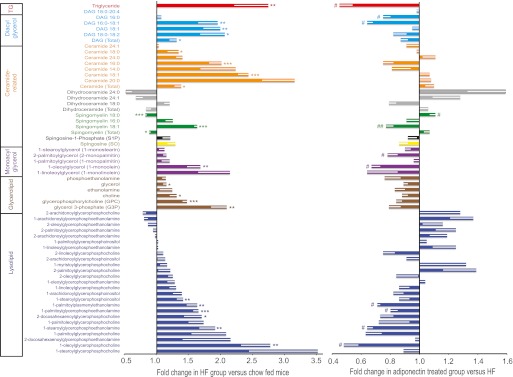
Lipidomic analysis in skeletal muscle. Analyses were performed on skeletal muscle from AdKO mice treated as described in clamp studies (Fig. 1) to establish lipidomic profiles. Individual metabolites as well as classification groups to which they belong are shown. First, the influence of HFD versus chow is shown as fold change observed in the HFD group versus chow-fed mice. In parallel, the right side of the graph shows fold change in adiponectin-treated versus saline-injected groups within the HFD group; thus, changes indicate a corrective effect of adiponectin. Data represent means ± SEM. *Significant difference between HFD group and chow diet group. #Significant difference between fAd and saline treatment within the HFD group. *#P < 0.05. **##P < 0.01. ***P < 0.001. n = 5–6. HF, high fat. (A high-quality color representation of this figure is available in the online issue.)