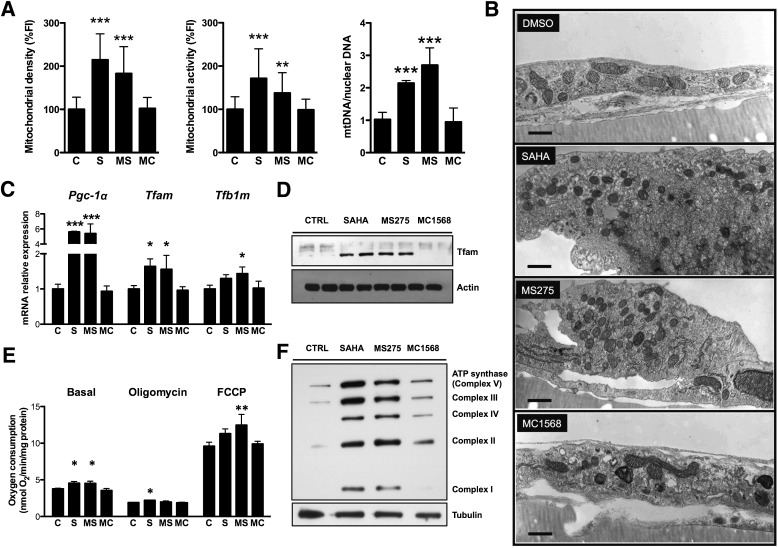
FIG. 1.
Inhibition of class I HDACs promotes mitochondrial biogenesis and oxidative metabolism in C2C12 myotubes. A: Quantification of mitochondrial density, activity, and mitochondrial DNA (mtDNA) in C2C12 myotubes after treatment with 5 μmol/L SAHA, 5 μmol/L MS275, 5 μmol/L MC1568, or vehicle. Fluorescence intensity (FI) of mitochondrial probes was normalized to a nuclear stain (Hoechst 33258). B: Representative electron microphotographs of ultrathin sections of C2C12 monolayers. The ultrastructural appearance of mitochondria in vehicle-treated cells was characterized by a dense matrix and well-organized cristae with dilated intracristae spaces in the typical condensed conformation of metabolically active cells (44). Treatment with SAHA or MS275 resulted in an increase in mitochondrial density and greater electron opacity of the matrix to the detriment of the development and organization of cristae. Cells treated with the class II HDAC inhibitor MC1568 showed rod-like mitochondria similar to those of controls (bars = 500 nm). C: Expression of genes associated with mitochondrial biogenesis (24 h) (C) and Western blot analysis of mitochondrial transcription factor A (Tfam) in C2C12 myotubes treated for 48 h with HDAC inhibitors (D). E: Measurement of oxygen consumption at the basal level and in the presence of oligomycin (2.5 μg/mL) or carbonyl cyanide 4-(trifluoromethoxy)phenylhydrazone (FCCP) (2.4 μmol/L) in C2C12 myotubes treated for 60 h with HDAC inhibitors. F: Western blot analysis of mitochondrial complexes I–V of the electron transfer chain in C2C12 myotubes treated with HDAC inhibitors for 48 h. Data are presented as means ± SD. *P < 0.05, **P < 0.01, ***P < 0.001 vs. control. C and CTRL, control; MC, MC1568; MS, MS275; S, SAHA.

