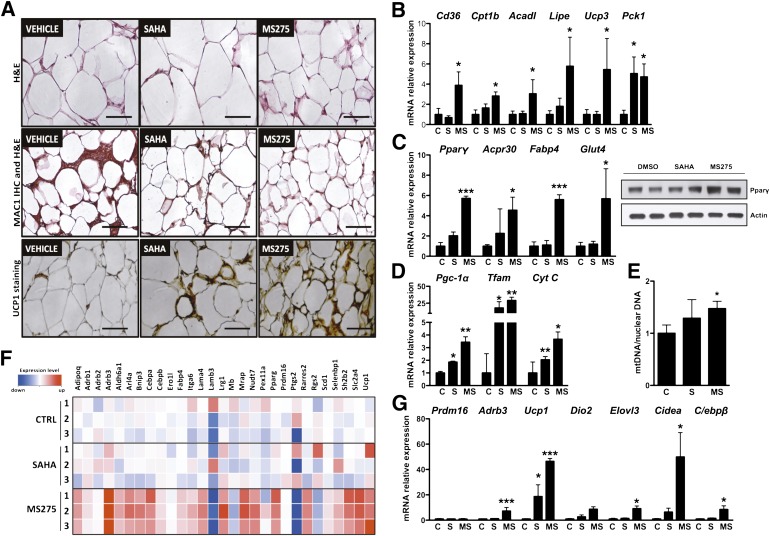
FIG. 7.
Inhibition of class I HDACs in WAT promotes oxidative metabolism, reduces inflammation, and induces the acquisition of brown fat features. A: top panel, hematoxylin-eosin (H&E) stain of WAT from db/db mice treated with HDAC inhibitors (bars = 100 μm); middle panel, Mac1 immunohistochemistry (IHC) confirms reduced macrophage infiltration (bars = 100 μm); and bottom panel, UCP1 staining in sections of WAT from treated db/db mice confirms the “browning” of WAT prompted by inhibition of class I HDACs (bars = 100 μm). B: Expression of genes involved in lipid metabolism and mitochondrial function. C: Increased expression of Pparγ and its direct targets in WAT of animals treated with MS275. D: Expression profile of genes involved in mitochondrial function after HDAC inhibitor treatment. E: Quantification of mitochondrial DNA in WAT after 23 days of treatment with SAHA, MS275, or vehicle. F: Heat map revealing the expression in MS275-treated WAT of multiple genes associated with BAT. G: Real time qPCR analysis showing that class I HDAC inhibition induces the expression of brown fat markers in white adipocytes. Data are presented as means ± SD. *P < 0.05, **P < 0.01, ***P < 0.001 vs. control. C and CTRL, control; MS, MS275; S, SAHA. (A high-quality digital representation of this figure is available in the online issue.)

