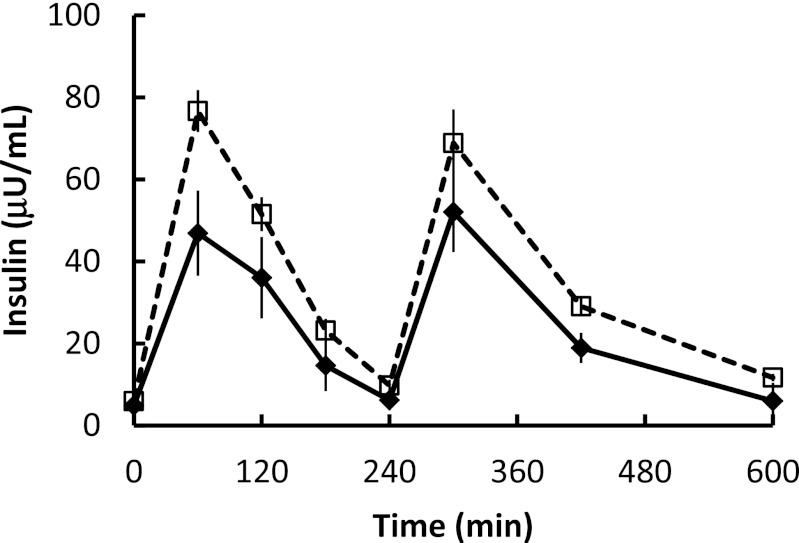
FIG. 1.
Daytime plasma insulin concentrations. Plasma insulin concentrations during the first 10 h of the experimental meal day. Black diamonds and solid lines, premenopausal women; white squares and dashed lines, postmenopausal women. AUC was greater (P = 0.008) in postmenopausal women than in premenopausal women.

