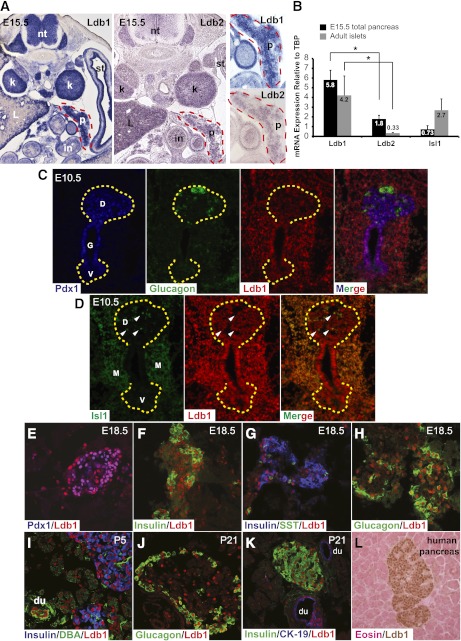
FIG. 1.
Ldb1 is enriched in islet and ductal cells. A: Ldb1 (left) and Ldb2 (middle) mRNA expression was visualized by RNA ISH under identical conditions in E15.5 tissue. A higher-magnification view of pancreatic Ldb1 and Ldb2 expression is shown on the right. B: qPCR was performed to measure Ldb1, Ldb2, and Isl1 mRNA levels in E15.5 total pancreas (black bars) and 3-month-old isolated islets (gray bars). Expression levels are displayed relative to TATA-binding protein (TBP), which is set as onefold. Error bars represent ± SEM (n = 5). Ldb1 mRNA is significantly more abundant than Ldb2 in E15.5 and adult samples. C–K: Ldb1, Pdx1, Isl1, hormone (insulin, glucagon, and somatostatin), and ductal (DBA, CK-19) markers were visualized at E10.5, E18.5, P5, and P21 by coimmunofluorescence. Yellow dashed lines mark dorsal and ventral pancreas domains in C and D. Notably, only a few of the pancreatic Ldb1+ cells in D are copositive for Isl1 at this stage (some marked by white arrowheads). L: Immunohistochemical analysis illustrates enriched Ldb1 protein (brown) expression in adult human islet cells; the sample is eosin (pink) counterstained. *P < 0.05. D, dorsal pancreas; du, duct; G, gut tube; in, intestine; k, kidney; L, liver; M, mesenchyme; nt, neural tube; P, pancreas (outlined with red dashed line); st, stomach; V, ventral pancreas. (A high-quality digital representation of this figure is available in the online issue.)

