FIG. 6.
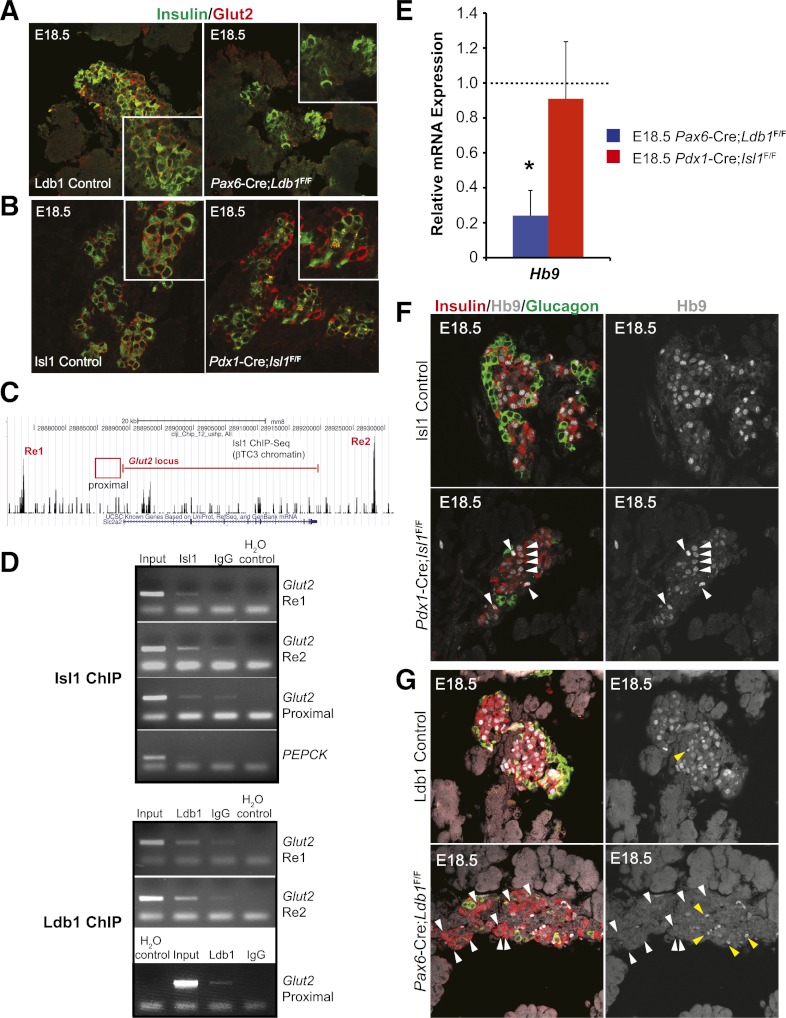
E18.5 Glut2 and Hb9 mRNA and protein expression is only compromised in Ldb1 mutant mice. Immunofluorescence analysis of Glut2 (red) and insulin (green) in the E18.5 control, mutant Ldb1 (A), and mutant Isl1 (B) pancreas. Insets show magnified insulin+ cell clusters. C: ChIP-Seq pictograph demonstrating Isl1 occupancy at distal Glut2 Re1 (5′) and Re2 (3′) domains in βTC-3 cells. The red line denotes the Glut2-coding region, whereas ChIP-tested proximal 5′ promoter region is represented by the red box. D: βTC-3 ChIP analysis of Isl1 (top panel) and Ldb1 (bottom panel) occupancy of Glut2 Re1, Re2, and the proximal domain compared with the PEPCK control (from top to bottom, respectively). H2O serves as a negative PCR control. Results recapitulate observed Isl1 ChIP-Seq occupation of Glut2 Re1 and Re2, whereas Ldb1 also binds to the proximal domain. E: qPCR analysis of E18.5 Hb9 mRNA levels in pancreata from Ldb1- (blue bar) and Isl1-deficient (red bar) pancreata. Littermate control mRNA level was set at onefold (dashed line) ± SEM. F: E18.5 immunostaining analysis demonstrates that Hb9 protein (white) is maintained in the insulin+ (red) nuclei of Pdx1-Cre;Isl1F/F pancreata as compared with littermate controls, as denoted by the white arrowheads. G: However, Hb9 is lost from most remaining insulin+ cells in the Pax6-Cre;Ldb1F/F pancreata seen by comparing white arrowhead–labeled Hb9+ cells of control and mutant in F and G. The nuclear Hb9 signals are shown in the right panels. Yellow arrowheads in G illustrate autofluorescence from erythrocytes. *P < 0.05. (A high-quality digital representation of this figure is available in the online issue.)

