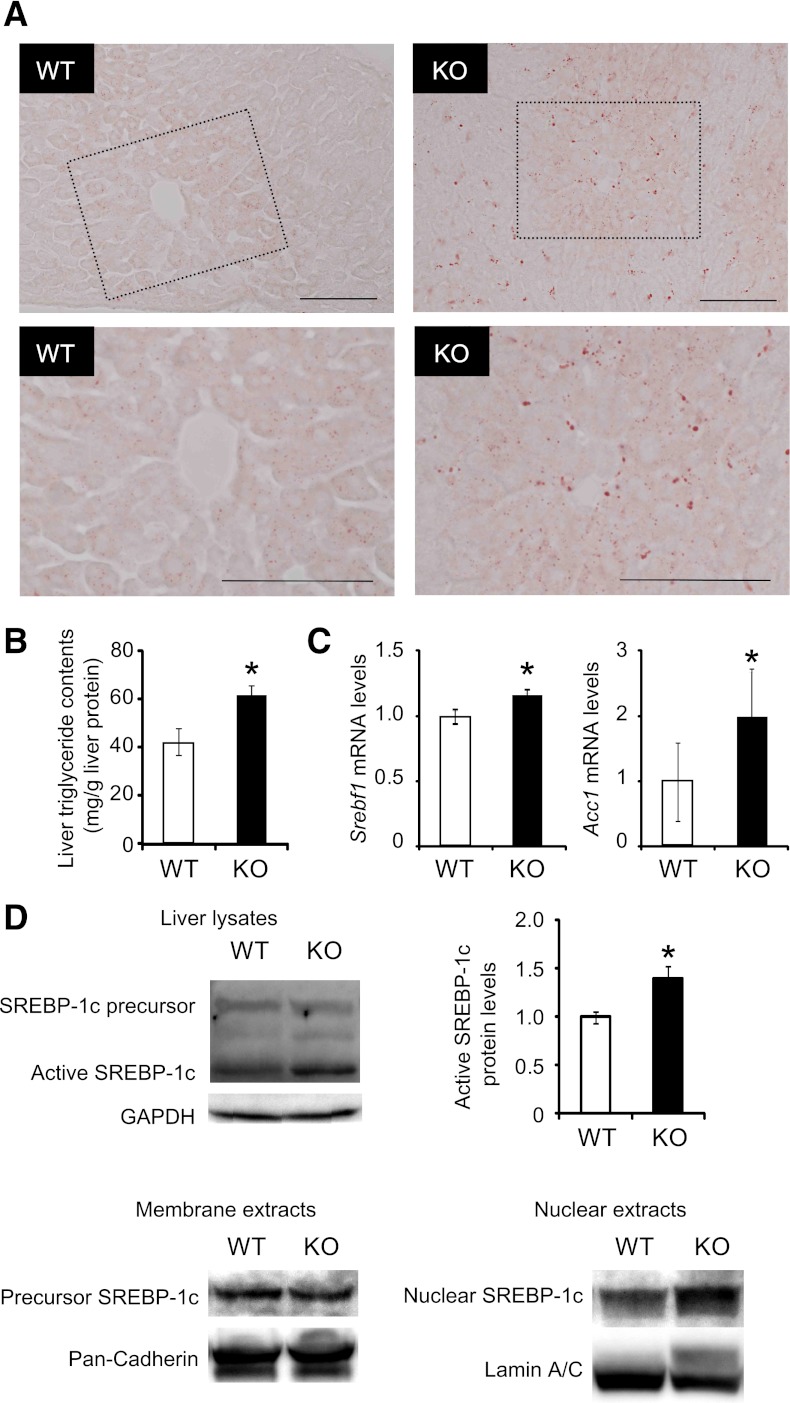
FIG. 4.
PA28 KO mice show hepatic SREBP-1c activation and steatosis. A: Oil-red O staining of lipid droplets in the livers of 12-week-old WT and PA28 KO mice. The highlighted region of the upper panel is shown at a higher magnification in the lower panel. Scale bars, 100 μm. B: Triglyceride contents in the livers of WT and PA28 KO mice. Data are expressed as milligrams per gram of liver tissue. Data represent means ± SE (n = 4–5 per group). *P < 0.05. C: Expression of mRNAs encoding Srebf1 and Acc1 in the livers of 12-week-old WT and PA28 KO mice analyzed by quantitative real-time RT-PCR. Expression values were normalized to GAPDH mRNA. Data represent means ± SE (n = 7–9 per group). D: Whole cell, membrane, and nuclear fractions in liver extracts were subjected to SDS-PAGE and blotted using an anti–SREBP-1 antibody. GAPDH, pan-cadherin, and lamin A/C served as internal controls. Quantitation of SREBP-1 68-kDa protein levels is normalized to GAPDH and is represented as means ± SE. *P < 0.05.

