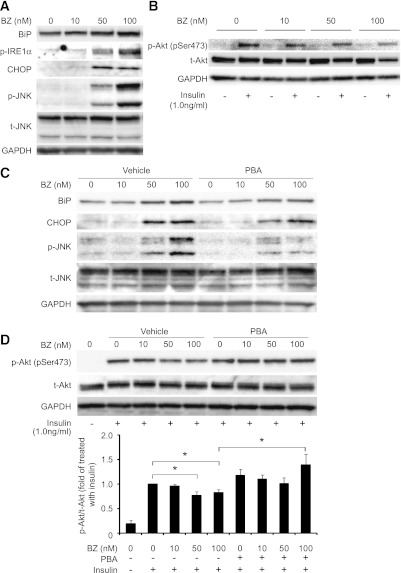
FIG. 8.
The proteasome inhibitor bortezomib (BZ) induces ER stress and insulin resistance in H4IIEC3 cells. A and B: H4IIEC3 cells were treated with the indicated concentrations of bortezomib (in DMEM supplemented with 10% FBS) for 24 h. After washing, cells were serum starved for 16 h and then treated with insulin (1 nmol/L) or phosphate-buffered saline for 15 min. Cells were solubilized, and equal amounts of proteins were analyzed by Western blotting using BiP-, p-IRE1α–, CHOP-, p-JNK–, total JNK (t-JNK)-, p-Akt–, and total Akt (t-Akt)-specific antibodies. C and D: H4IIEC3 cells were pretreated or not for 24 h with 2 mmol/L PBA and then treated with the indicated concentrations of bortezomib (in DMEM supplemented with 10% FBS) for 24 h. Cells were washed, serum starved for 16 h, and treated with insulin (1 nmol/L) or phosphate-buffered saline for 15 min. Cells were solubilized, and equal amounts of proteins were analyzed by Western blotting using BiP-, CHOP-, p-JNK–, total JNK–, p-Akt–, and total Akt–specific antibodies. Blots of p-Akt were quantitated densitometrically and expressed as ratios to total Akt (n = 4 for each condition). Relative density is mean ± SE fold increase over control. *P = 0.05 vs. treatment with insulin alone.

