FIG. 1.
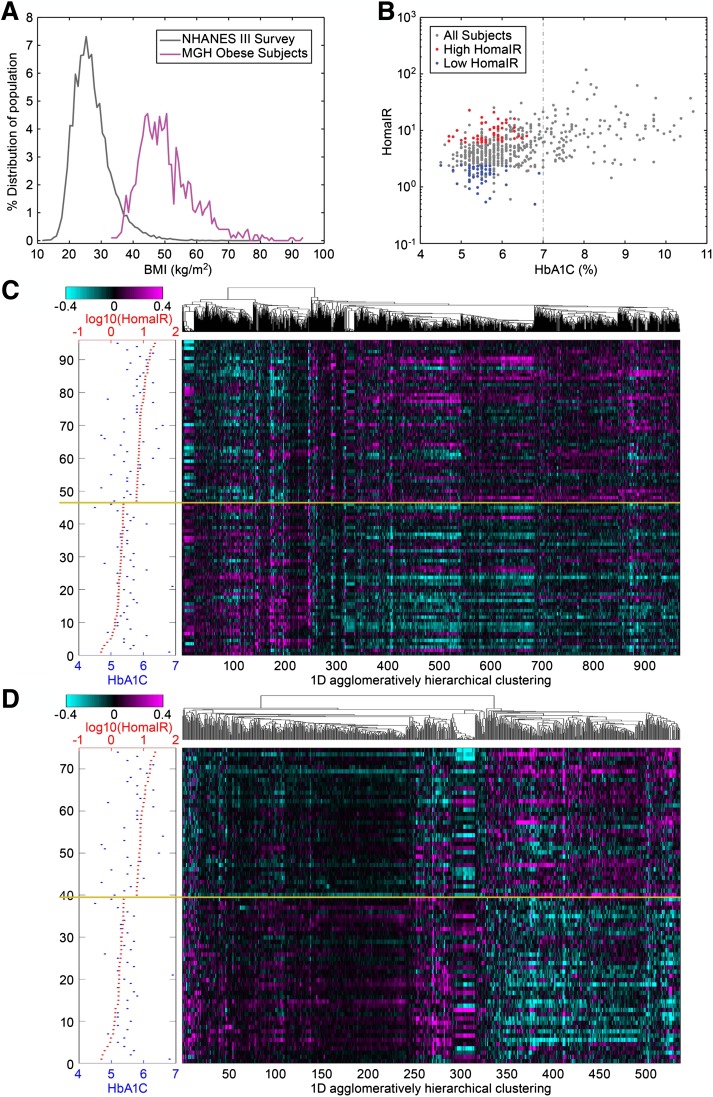
A: The BMI distribution curve (magenta) for patients who were involved in the RYGB profiling experiments, and the BMI distribution curve (gray) for the general population in National Health and Nutrition Examination Survey (NHANES) III survey. B: A dot plot comparing HOMA-IR trait vs. HbA1c trait for the patients who were involved in our profiling studies (nondiabetic, did not use any medicine, and had HbA1c <7%; gray). The red dots represent patients who had higher HOMA-IR level (top 15%), the blue dots represent patients who had lower HOMA-IR level (bottom 15%) among the patients included in the profiling analysis. C: A heat map showing the one-dimensional histogram of the 968 selected omental genes that differentiate between high and low HOMA-IR levels in the unsupervised analysis. Magenta in the heat map indicates upregulation and cyan indicates downregulation for the individual patient sample compared with the pool of all patient samples. D: A heat map showing the one-dimensional histogram of the 546 selected subcutaneous genes that differentiate between high and low HOMA-IR levels in the unsupervised analysis. The methodology used for calculating the algorithms for unsupervised clustering can be found in the Supplementary Materials. (A high-quality digital representation of this figure is available in the online issue.)

