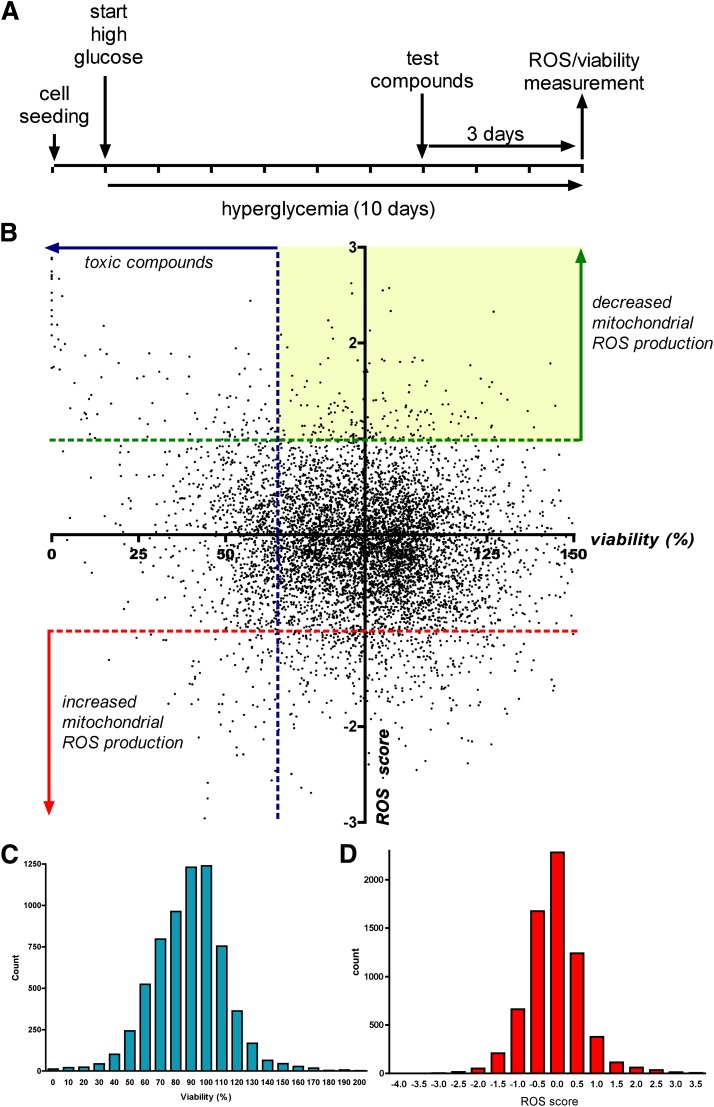
FIG. 2.
Cell-based screening for compounds that decrease the mitochondrial ROS production in endothelial cells. A: Timeline of the cell-based screening: bEnd.3 cells were exposed to hyperglycemia for 10 days with 3-day-long compound treatment (3 μmol/L). Mitochondrial ROS production was measured with the superoxide MitoSOX Red with simultaneous assessment of viability. B: Dot graph showing the individual ROS/viability results of the tested 6,766 compounds. Oxidant production data are shown as ROS score (1 ROS score = 25% decrease in ROS production compared with hyperglycemic average value) and viability values are plotted as percent values. The yellow area denotes the compounds that decreased the ROS production without marked reduction of cellular viability. Distribution of viability (C) and ROS (D) data (SD of viability = 24.69%, SD of ROS score = 0.717, or SD of ROS production = 17.93%).

