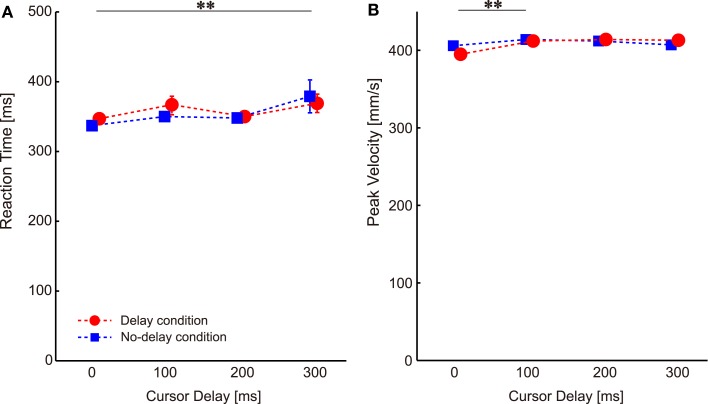
Figure 4.
Changes in the movement parameters throughout the experiments. (A) Reaction time. (B) Peak velocity. Data are sorted according to the cursor delay in the previous perturbation trials. The double asterisks illustrate the significant difference between cursor delays revealed by Ryan’s multiple comparison tests. Error bars indicate standard error.

