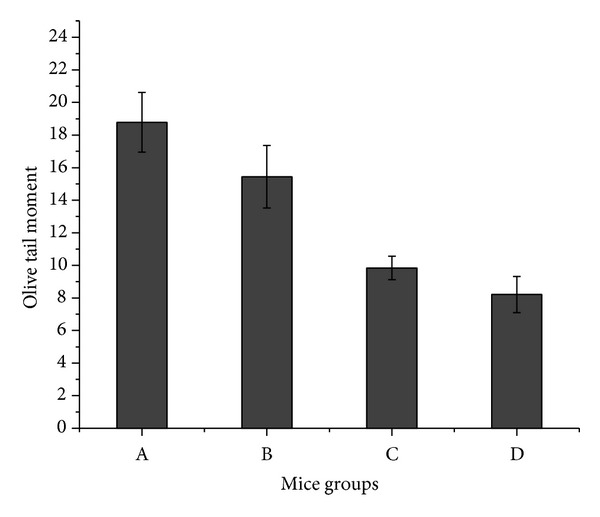
Figure 3.

The values of olive tail moment assessed by comet assay for mice group (A) treated with cisplatin followed by exposure to ELF-MF, mice group (B) treated with cisplatin, mice group (C) treated by exposure to ELF-MF, and mice group (D) the control one. Each value represents the mean ± S.E. (n = 5, P < 0.019).
