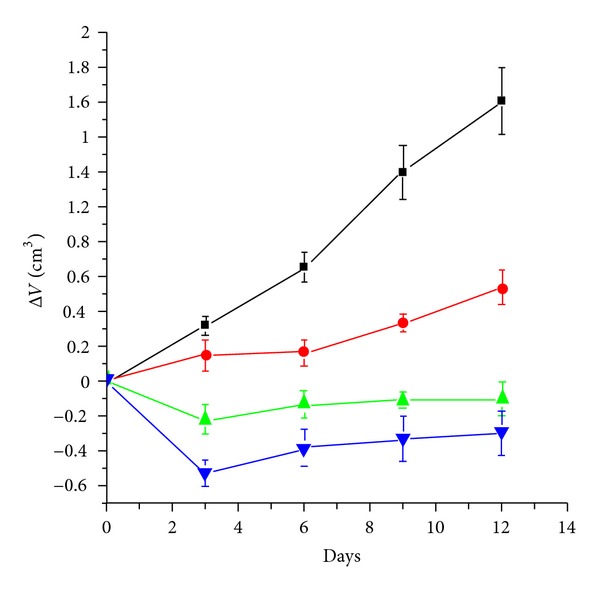
Figure 5.

Average changes in Ehrlich tumor volume throughout a period of 12 days for mice group A (blue, (▼)) treated with cisplatin followed by exposure to ELF-MF, mice group B (green, (▲)) treated with cisplatin, mice group C (red, (•)) treated by exposure to ELF-MF, and mice group D (black, (■)) the control one. Each value represents the mean ± S.E. (n = 10).
