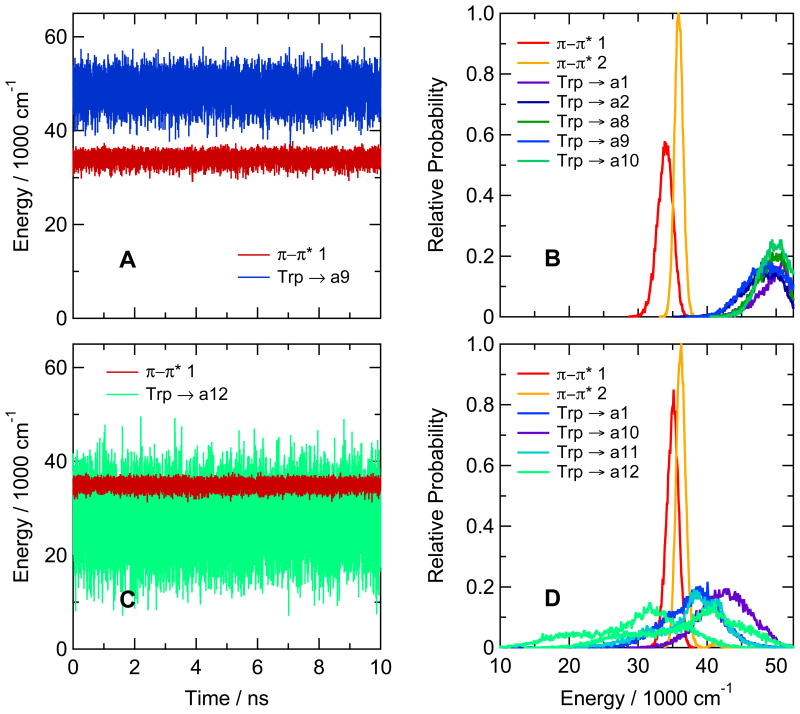
Figure 3.
(A) Calculated energies for excitation from the ground state to the first excited singlet π–π* state (π–π* 1, red curve) and the CT state with the lowest mean energy (Trp → a9, blue) in the hairpin peptide with Trp at position 1 and Ala at position 8 (Ac-WVTIpGKAIFTG-NH2). The traces were generated by catenating data from twenty 0.5-ns trajectories in the lowest excited singlet π–π* state, beginning by projections from a trajectory in the ground state. The first trajectory in the excited state started after 0.5 ns in the ground state, and the others followed at 0.1-ns intervals. Backbone amide groups are designated by “a” followed by a number indicating the residue that provides the amino group for the amide. The amide group between the N-terminal acetyl cap and W1 in this peptide thus is a1, and the amide between Ala8 and Ile9 is a9. CT states are designated by the side chain or amide that serve as the electron donor and acceptor, connected by an arrow. (B) Distributions of energies of the first two excited singlet π–π* states (red and orange curves) and the first five CT states (blue, green, and purple curves) of the same hairpin peptide as in A, averaged over the twenty trajectories in the excited state. In this peptide, electron transfer from the indole ring of Trp1 to backbone amides a1, a2, a8, a9 and a10 gives CT states with similar distributions of energies, all of which lie above the first two π–π* states. Various configurations (combinations of wavefunctions) give multiple CT states in which the same two groups of atoms serve as the electron donor and acceptor; this panel shows only the lowest-energy configuration for each donor-acceptor pair. (C) The same as A, but for the hairpin peptide with Phe at position 1 and Trp at position 10 (Ac-FVTIpGKAIWTG-NH2). The lowest CT state here is Trp → a12 (light green). (D) The same as B, but for the hairpin peptide with Phe at position 1 and Trp at position 10. The lowest CT states are Trp → a12 (light green), Trp → a11 (cyan), Trp → a1 (blue) and Trp → a10 (purple). Energy distributions for CT states with two different configurations are shown for Trp → a12; the second has approximately the same shape as the first, but is displaced to higher energies by about 10,000 cm−1. Only the lowest-energy configuration is shown for the other donor-acceptor pairs. The amplitudes are proportional to the relative number of times that the energy was in the corresponding bin. All bin widths are 100 cm−1, but the areas under the curves are not necessarily equal, because only the first 16 states were identified at each time point.

