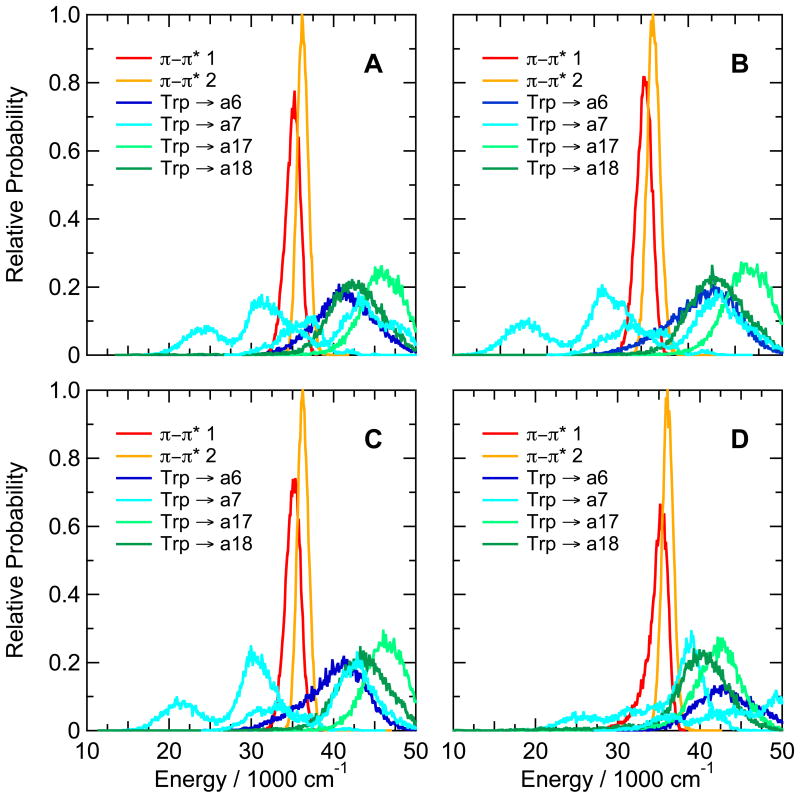
Figure 9.
Calculated distributions of excitation energies of the first two excited singlet π–π* states and the low-lying CT states of (A) the Asp9Glu variant of the Trp-cage 10b peptide DAFAQWLKDGGPASGRPPPS, (B) the ΔSer20 variant, (C) the Lys8Ala variant, and (D) the Asp9Arg/Arg16Glu variant. The energy distributions were averaged over twenty 0.5-ns trajectories in the first excited singlet state. Backbone amide groups (blue, cyan, and light and dark green curves) are designated as in Figures 3 and 8. Two configurations are shown for electron transfer to a7 (cyan).

