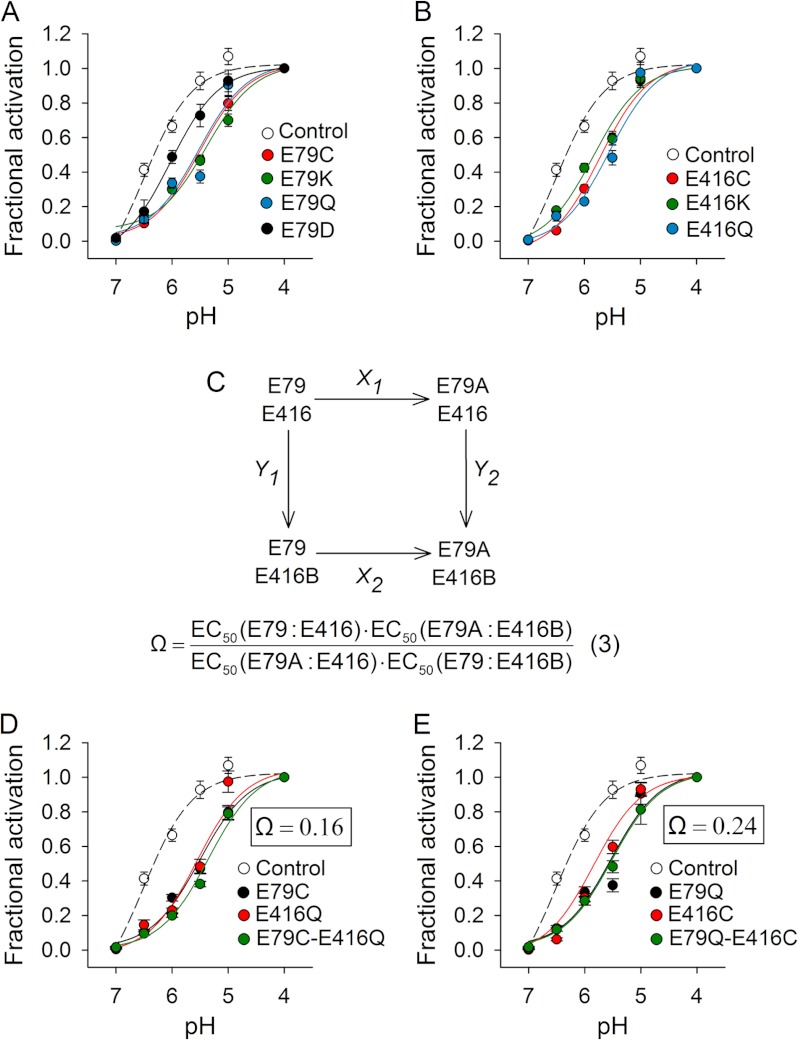
FIGURE 2.
Functional coupling of Glu-79 and Glu-416. A and B, proton activation curves for control (C70L) and mutant channels. Proton-activated currents were elicited by a drop in extracellular pH from 9.0 to solutions of lower pH. Currents were normalized to the signal obtained at pH 4.0 (n = 8–30). C, double mutant cycle for Glu-79 and Glu-416. Shown is the apparent proton affinity (EC50) for the control channel (E79:E416) and the single (E79A:E416 and E79:E416B) and double (E79A:E416B) mutant channels. D and E, proton activation curves for control, single, and double mutant channels. Proton-activated currents were elicited by a drop in extracellular pH from 9.0 to solutions of lower pH. Currents were normalized to the signal obtained at pH 4.0 (n = 9–28). The coupling coefficient (Ω) was calculated according to Equation 3 for double mutant cycles.

