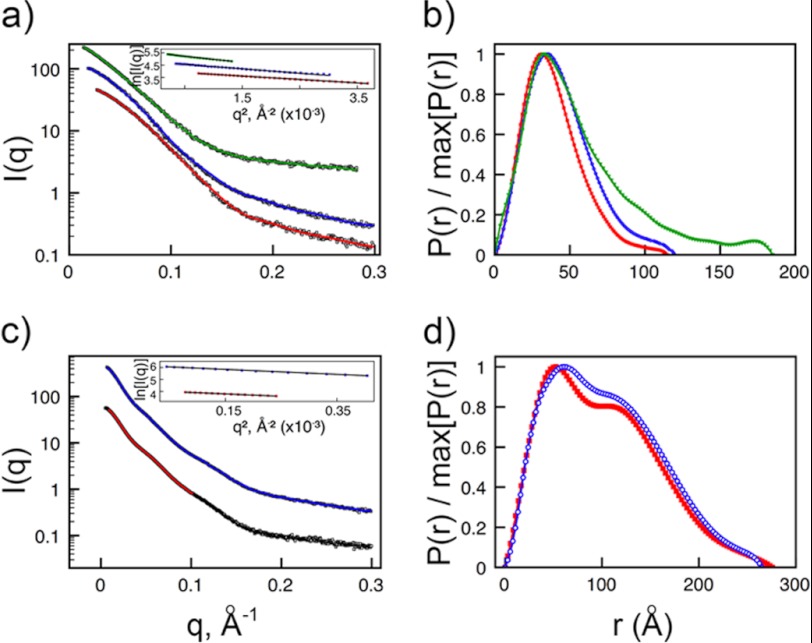
FIGURE 5.
SAXS analysis of IT4VAR13·ICAM-1 complexes. a, shown is theoretical scattering calculated from ab initio reconstructions (continuous lines with IT4VAR13DBLβ in red, IT4VAR13DBLβ·ICAM-1D1D2 in blue, and IT4VAR13DBLβ-ICAM-1D1D5 in green) superimposed onto experimental scattering intensity curves (squares). Guinier plots are inset. b, shown are distance distribution function, P(r), plots for IT4VAR13DBLβ (squares, red); IT4VAR13DBLβ·ICAM-1D1D2 (circles, blue), and IT4VAR13DBLβ·ICAM-1D1D5 (triangles, green). c, theoretical scattering is calculated from ab initio reconstructions for full-length IT4VAR13 ectodomain (continuous lines with IT4VAR13 in red and IT4VAR13-ICAM-1D1D5 in blue) superimposed onto the experimental scattering intensity curves (squares). d, shown are P(r) plots for IT4VAR13 (squares, red) and IT4VAR13·ICAM-1D1D5 (circles, blue). The P(r) functions were calculated from the scattering intensity I(q) and normalized to unity at their maxima.

