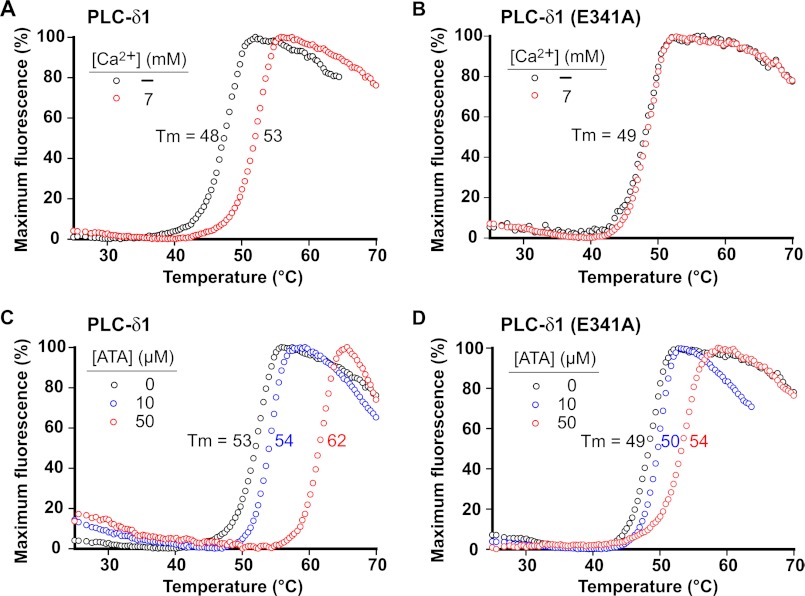
FIGURE 4.
PLCδ1 is stabilized by ATA in thermal shift assay. Shown are plots of the fluorescence changes of PLCδ1 (A) and PLCδ1(E341A) (B) as the temperature was increased in the presence or absence of Ca2+ (7 mm). With the concentration of Ca2+ at 7 mm, the fluorescence changes of PLCδ1 (C) and PLCδ1(E341A) (D) as the temperature was increased in the presence of increasing concentrations of ATA were then recorded. The mean Tm was calculated from a single experiment in which each condition was assayed in triplicate as described under “Experimental Procedures.”

