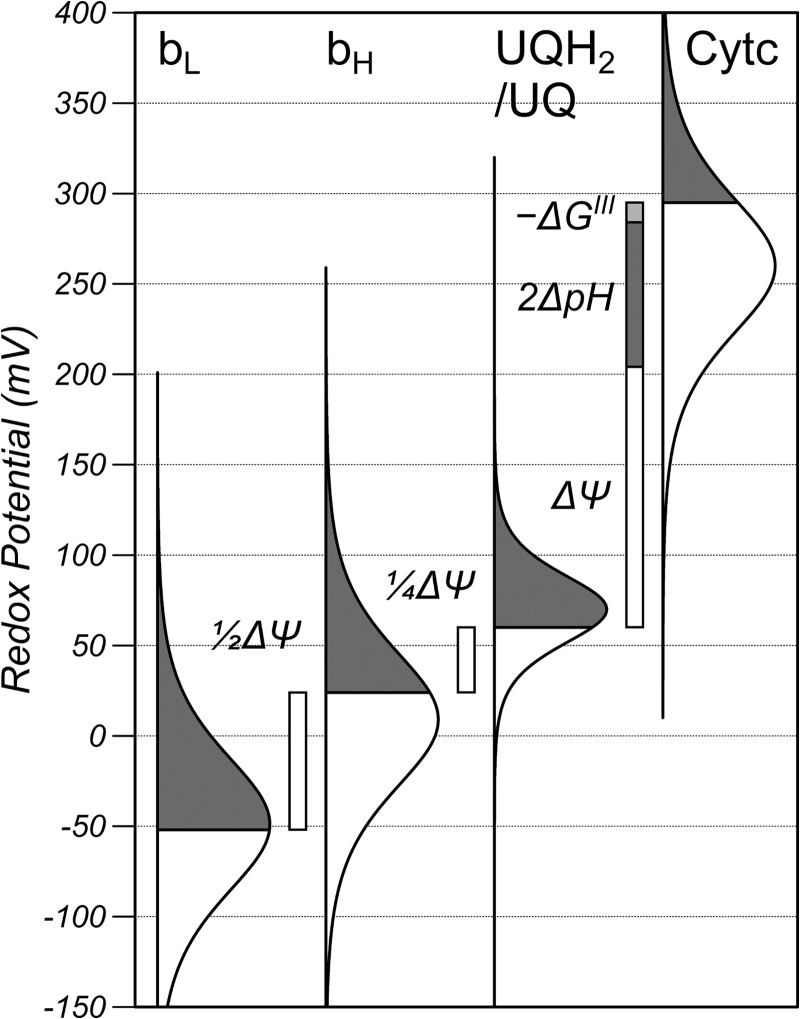
FIGURE 1.
The redox poise of the bc1 complex in RAW cells under normal conditions and relationship between the redox potentials, ΔΨ, ΔpH, and the disequilibrium of the bc1 complex (−ΔGIII). The redox potential is plotted on the y axis, and the bell-shaped curves are a precise graphical representation of the Nernst equation, where the gray area represents the reduced fraction, the white area represents the oxidized fraction, and the line of symmetry is the midpoint potential. The shape of the UQH2/UQ curve is narrower than the hemes because it is an n = 2 electron carrier, and the midpoint has been shifted from the pH 7.0 value (90 mV) to account for the pH of the matrix. The bH and bL curves are shown as simple n = 1 Nernst functions with effective midpoint potentials of 9 and −49 mV, respectively, to account for their oxidation state, but the actual shapes are more complicated because of their redox anti-cooperativity.

