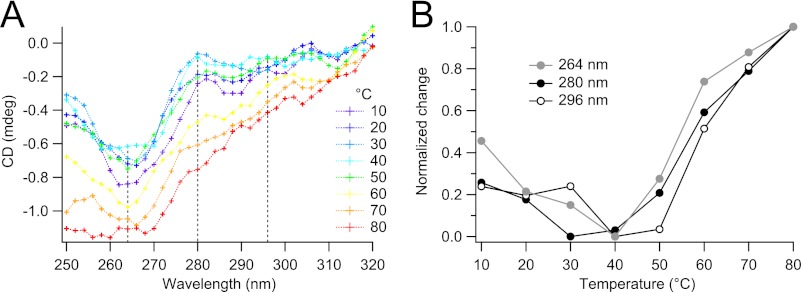
FIGURE 6.
Temperature dependence of 5-HT3R in C12E9 measured by near-UV circular dichroism. A, after a 5-min equilibration, CD spectra were recorded between 10 and 80 °C in 10 °C increments. B, development of CD signal with increasing temperature at three different wavelengths (264, 280, and 296 nm), corresponding roughly to the signal of phenylalanine, tyrosine, and tryptophan, respectively.

