
TABLE 1.
Phylogenetic distribution of γ-CA and 20.9-kDa subunits of CI
Major taxonomic groups are based on Fig. 2 of Brown et al. (51). Shaded and boldface entries indicate that there is direct evidence for one or more of the corresponding components in mitochondria and/or isolated CI, as described under “Results” (further details are also provided in supplemental Data Set S4). +/−, presence/absence of the 20.9-kDa subunit gene in a given organism. Data in the table are taken largely from publicly available genome/transcriptome sequencing projects, where gene coverage is likely to be high. Additional sequences for other organisms as well as other information (accession numbers, mitochondrial targeting probabilities) may be found in supplemental Data Set S4.
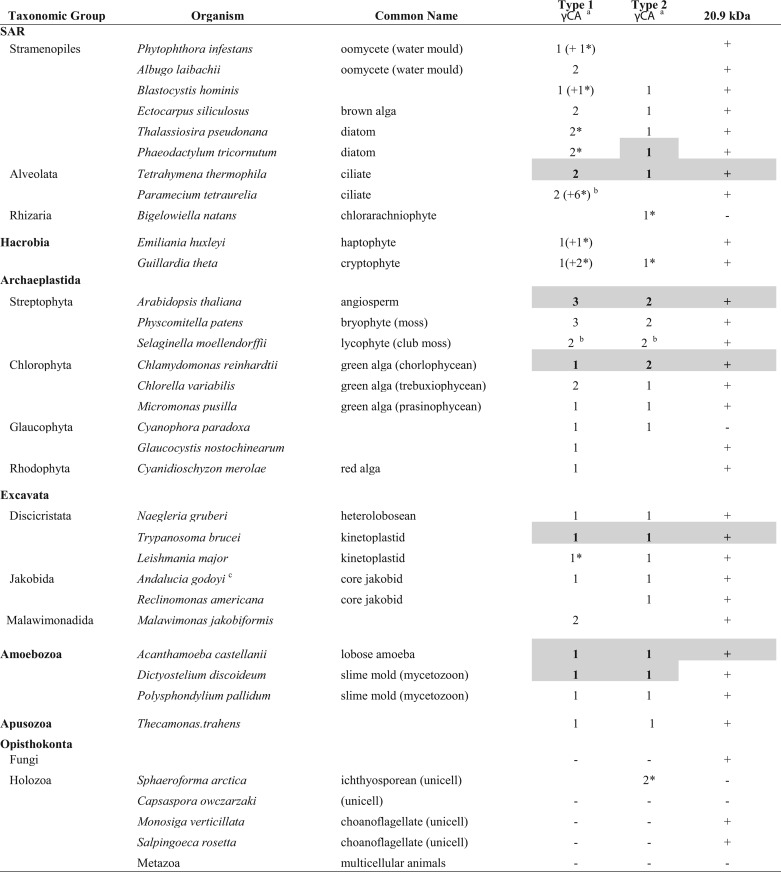
a γ-CA homologs can be classified into two types, based on a high degree of conservation (Type 1) or not (Type 2) in the N-terminal region (12). Plant γ-CAs fall into the Type 1 category, whereas plant γ-CALs are included among Type 2 γ-CAs. An asterisk denotes that the γ-CA Type assignment is tentative.
b γ-CA multiplicity attributable to genome duplication(s).
c Unpublished data from the A. godoyi genome project.