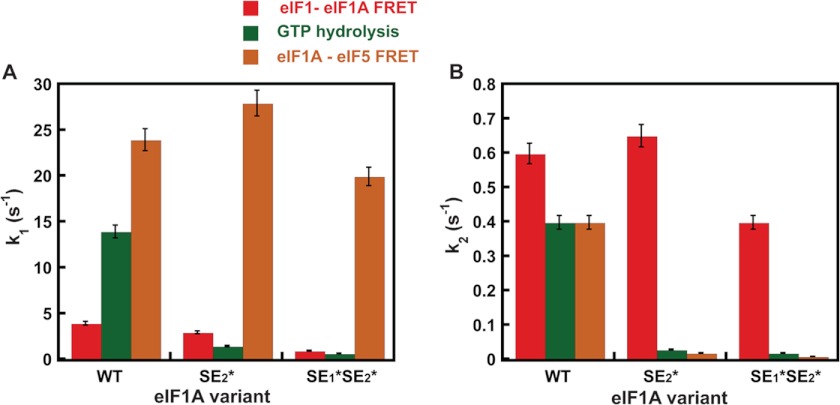
FIGURE 4.
Comparison of rate constants for eIF1-eIF1A FRET change, GTP hydrolysis, and eIF1A-eIF5 FRET change upon start codon recognition by the PIC. A, rate constants (k1) for the first phase of the decrease in eIF1-eIF1A FRET (red), GTP hydrolysis (green), and increase in eIF1A-eIF5 FRET (orange) upon start codon recognition by the PIC. For eIF1-eIF1A FRET, this phase corresponds to a first-order event, probably a conformational change. For the GTP hydrolysis reaction, this phase corresponds to a step or steps that limit the rate of cleavage of GTP to produce GDP and Pi. B, rate constants (k2) for the second phase of the decrease in eIF1-eIF1A FRET (red), GTP hydrolysis (green), and increase in eIF1A-eIF5 FRET (orange) upon start codon recognition by the PIC. For eIF1-eIF1A FRET, this phase corresponds to eIF1 release from the PIC, and for GTP hydrolysis, this phase corresponds to Pi release from eIF2, which drives the reaction to completion. PICs were assembled with WT eIF1A, eIF1A-SE1*SE2*, or eIF1A-SE2*. Data shown are averages of at least three experiments, and error bars represent average deviations.

