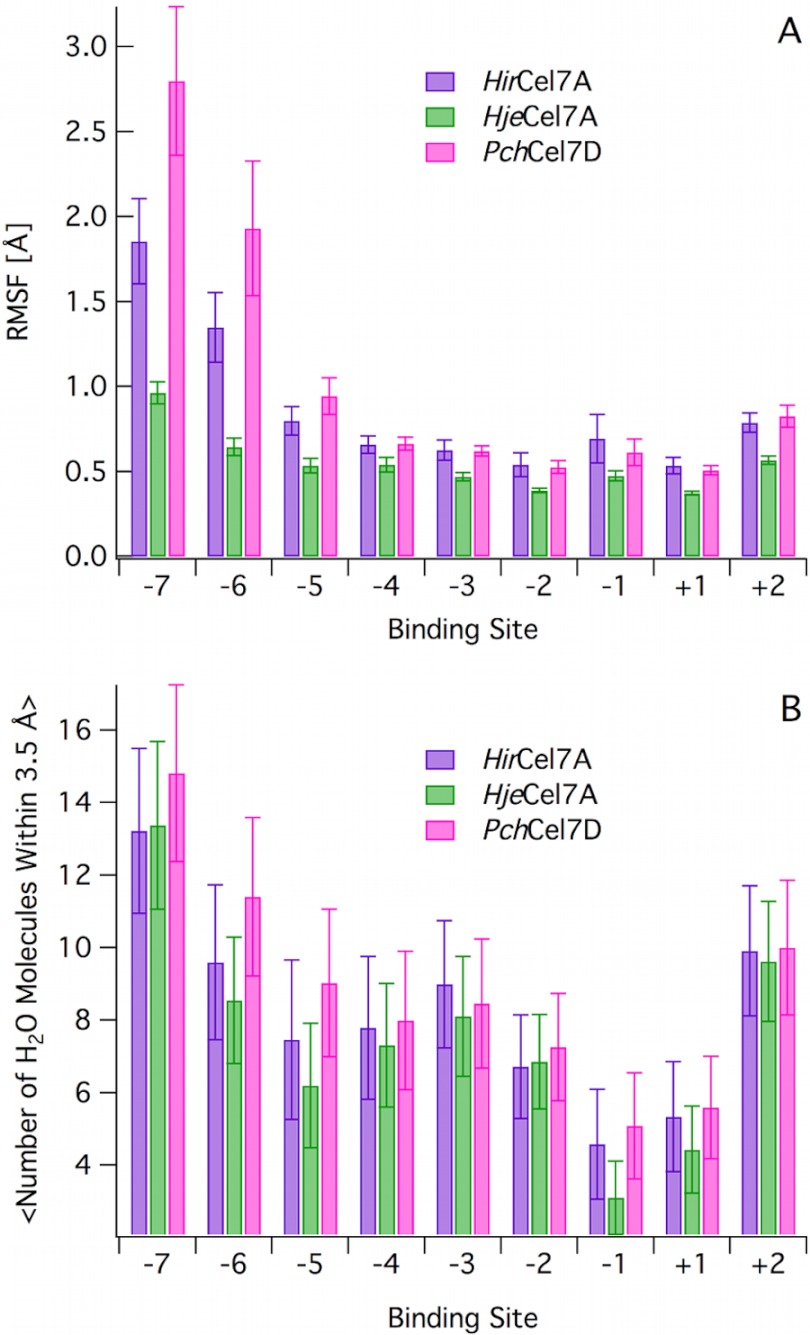
FIGURE 6.
A, ligand RMSF as a function of binding site. The RMSF values were calculated based on the heavy atoms for each glucose. The error bars are computed with block averaging. B, ligand solvation as a function of binding site. Solvation was calculated as average number of water molecule within 3.5 Å of the heavy atoms of the d-glucose unit at each subsite. The error bars represent one standard deviation from the average value.

