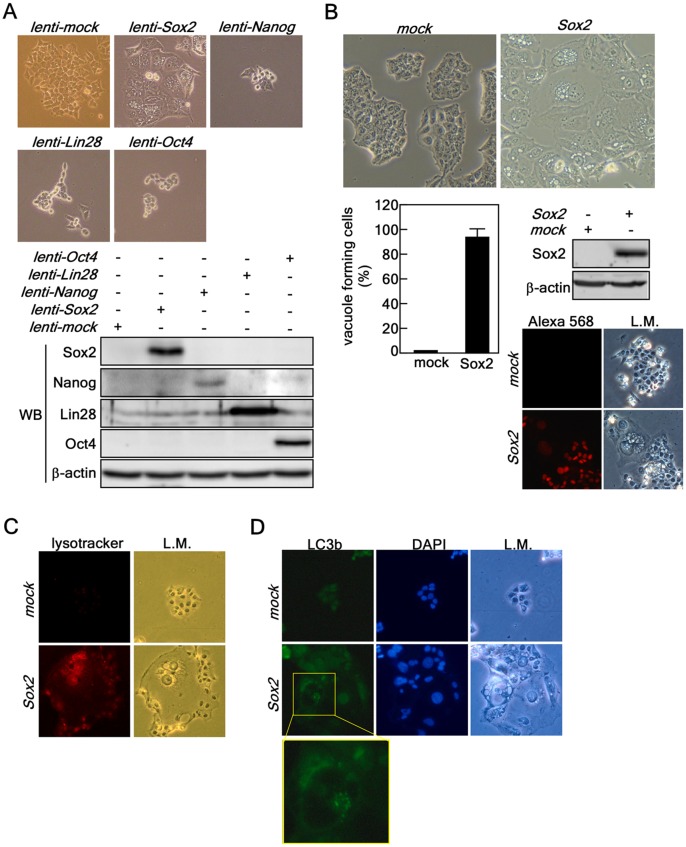
Figure 1. Ectopic expression of Sox2 induces autophagy.
(A) Comparison of morphological changes induced by ectopic expression of iPS factors. (Upper panels) HCT116 cells were individually transduced with iPS factors, including Sox2, Nanog, Lin28 and Oct4. The cells were cultured for 5 days and changes were observed under a light microscope (X200). (Lower panels) HCT116 cells were harvested at 5 days after transduction with iPS factors and proteins extracted. The protein levels of the Sox2, Nanog, Lin28 and Oct4 were analyzed by Western blotting with specific antibodies as indicated. ß-Actin was used as an internal control to verify equal protein loading. (B) HCT116 cells forming vacuoles at 5 days after transduction were observed under light microscopy, counted and compared. Sox2 overexpression was analyzed by Western blotting and immunocytofluorescence assay (X200) using specific antibodies as indicated. ß-Actin was used as an internal control to verify equal protein loading. The cells were visualized by light microscopy (L.M.; X200). (C) Lysosomal activation analysis. HCT116 cells infected with mock or Sox2 were stained by adding lysotracker (50 nM) into the culture medium for 5 min in a 37 oC, 5% CO2 incubator. The cells were fixed with 4% formalin, washed with PBS and lysosomal activation was observed under a fluorescence microscope (X200). (D) Immunofluorescence assay of LC3b (i.e., ATG8b). HCT116 cells stably expressing mock or Sox2 were subjected to a fluorescence assay to detect LC3b. The cells were observed under a fluorescence microscope (X200). The nuclei were stained with DAPI; L.M. indicates light microscopy (X200).

