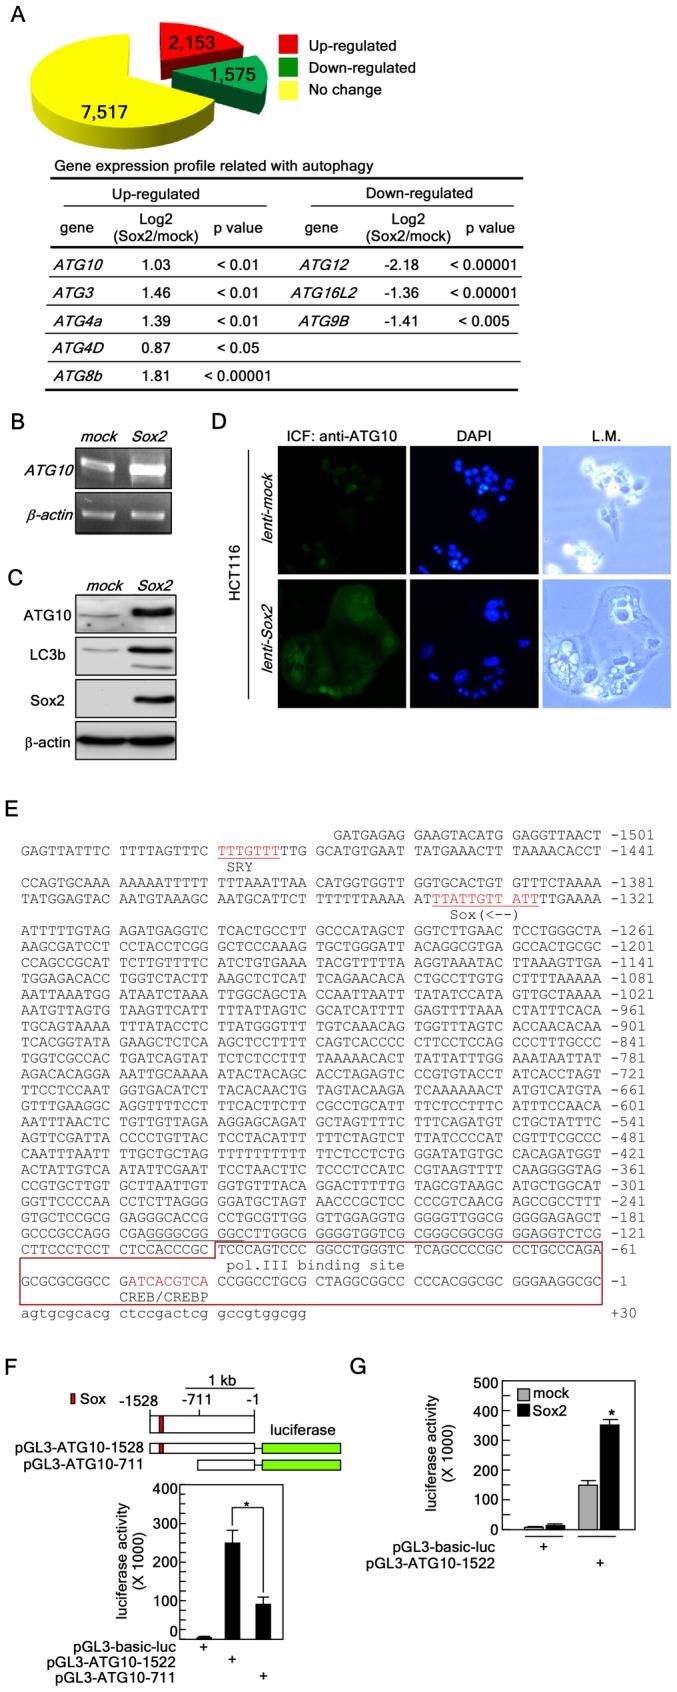
Figure 3. Sox2 targets ATG10 to induce autophagy.

(A) Microarray. Top panel, HCT116 colorectal cancer cells stably expressing mock or Sox2 were subjected to microarray analysis as described in “Materials and Methods”. The yellow color indicates the number of genes that did not show a significant difference between mock and Sox2 expression. The red and green colors indicate the number of genes up- or down-regulated, respectively, in HCT116 cells stably expressing Sox2 compared with cells expressing the mock control. Bottom table, summary of autophagy-related genes obtained from the microarray analysis. Up- and down-regulation are denoted in Log2 values. (B) Expression of ATG10 induced by Sox2. Total RNA (1 µg) from HCT116 cells infected with mock or Sox2 was reverse transcribed and ATG10 was amplified by cycle-dependent PCR and the ATG10 expression level was visualized by agarose gel electrophoresis at the 21st cycle. ß-Actin was used as an internal control to verify equal utilization of cDNA for PCR. (C) Up-regulation of ATG10 and LC3b protein levels induced by Sox2 expression. Proteins were extracted from HCT116 cells stably expressing mock or Sox2 and ATG10 and LC3b proteins were visualized by Western blotting using specific antibodies. ß-Actin was used as an internal control to verify equal protein loading. (D) Confirmation of Sox2-induced ATG10 protein level. HCT116 colorectal cancer cells were infected with mock or Sox2 and cultured 5 days. The cells were fixed, hybridized with an ATG10 specific primary antibody and Alexa 488-conjugated secondary antibody. The ATG10 protein levels were observed by fluorescence microscopy. L.M. indicates the same area of light microscopy corresponding to fluorescence microscopy (X200). (E) Construction of the ATG10 promoter luciferase reporter plasmid. The nucleotide sequences of the human ATG10 promoter region were downloaded from Ensemble (http://uswest.ensemble.org). The putative promoter analysis was conducted using TFSEARCH (v1.3) (http://cbrc.jp/htbin/nph-tfsearch). The putative SRY and Sox binding consensus sequences are denoted in red and the polymerase III binding site is boxed. (F) The BAC clone (RP11-111B20) was purchased from Empire Genomics (Buffalo, NY) and 1528 and 711 bp of the ATG10 promoter region were amplified by PCR. The PCR fragment was recombined with the pGL3 basic vector to construct pGL3-AT10-1582 and pGL3-ATG10-711 luciferase reporter plasmids. The pGL3-ATG10-luc reporter plasmids were confirmed by DNA sequencing. The ATG10 promoter luciferase reporter plasmids, pGL3-AT10-1582 and pGL3-ATG10-71-luc, were transiently transfected into HCT116 cells and the firefly luciferase activity was analyzed after 24 h. The phRL-SV40 renilla luciferase reporter plasmid was co-transfected as an internal control to verify equal transfection and normalization of firefly luciferase activity (*p<0.001). (G) The pGL3-ATG10-1528 luciferase reporter plasmid was transiently co-transfected with a mock or Sox2 viral expression vector into HCT116 cells and the firefly luciferase activity was analyzed after 24 h. The phRL-SV40 renilla luciferase reporter plasmid was co-transfected as an internal control to verify equal transfection and normalization of firefly luciferase activity (*p<0.001).
