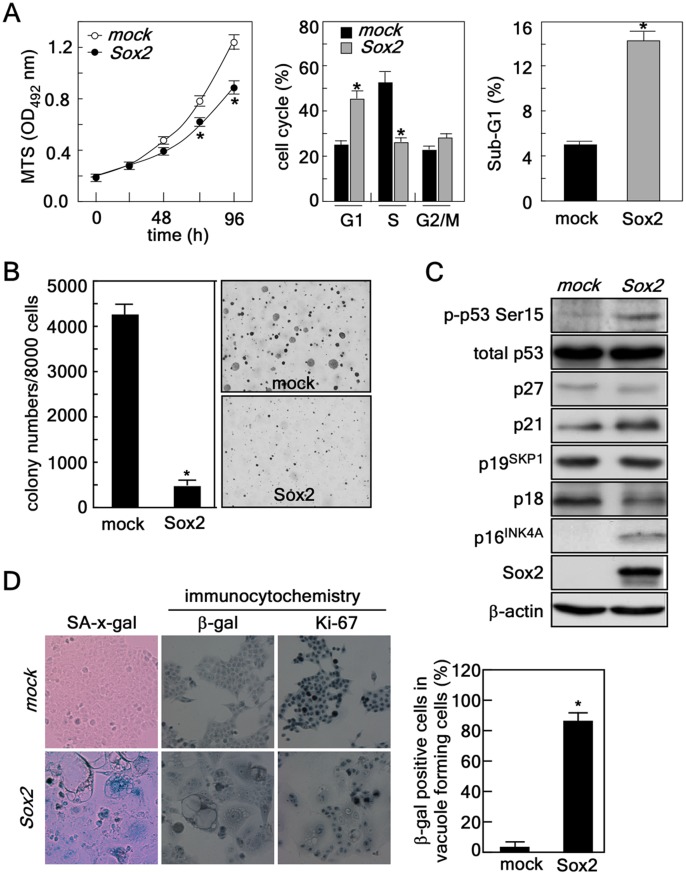
Figure 5. Sox2-induced autophagy causes senescence in HCT116 colorectal cancer cells resulting in suppressed proliferation and decreased anchorage-independent colony growth.
(A) Left panel, effect of Sox2 expression on cell proliferation. HCT116 cells (2×10³) stably expressing mock or Sox2 were seeded in 96-well plates and proliferation was analyzed by MTS assay at 24 h intervals up to 96 h (*, p<0.001). Middle and right panels, effect of Sox2 expression on cell cycle distribution. HCT116 cells (4×10⁵) stably expressing mock or Sox2 were seeded, cultured and then cell cycle distribution (middle panel) and sub-G1 accumulation (right panel) were analyzed by FACS (*, p<0.001). (B) Effect of Sox2 expression on anchorage-independent colony growth. HCT116 cells (8×10³) stably expressing mock or Sox2 were subjected to a soft agar colony growth assay for 5–7 days. The cell colonies were scored using a microscope and the Image-Pro PLUS (v.6) computer software program (*p<0.001). (C) Protein profiling related to cell cycle regulation. Proteins were extracted from HCT116 cells stably expressing mock or Sox2 and subjected to Western blotting to detect the level of various proteins known to be involved in cell cycle regulation. ß-Actin was used as an internal control to verify equal protein loading. (D) Cellular senescence assay. Left panel, HCT116 cells stably expressing mock or Sox2 were analyzed for senescence using a senescence ß-galactosidase staining kit. The cells were observed under a light microscope (X200). Middle and right panels, the protein level of ß-galactosidase or Ki-67 was detected in HCT116 cells stably expressing mock or Sox2 using specific primary antibodies as indicated and an HRP-conjugated secondary antibody. Immunocytochemical detection was performed using the Sigma FASTTM 3,3′-Diaminobenzidine Terahyfrochloride with Metal Enhancer Tablet Sets (DAB peroxidase substrate). The protein levels were visualized using a light microscope (X200). Graph, indicates a comparison of ß-galactosidase positive cell population in HCT116 cells stably expressing mock or Sox2 (*p<0.001).

