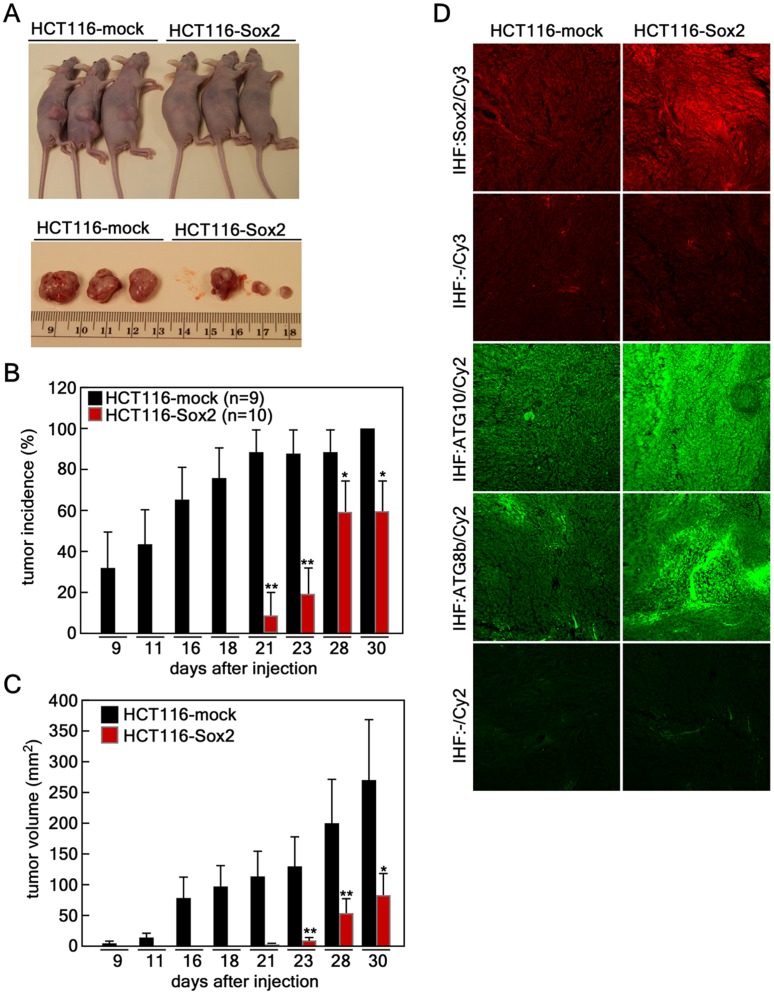
Figure 7. Sox2-induced autophagy suppresses cancer growth in a xenograft mouse model.
(A) Xenograft in vivo tumor growth. HCT116 cells (3×10⁶) stably expressing mock (n = 9) or Sox2 (n = 10) were injected subcutaneously into the dorsal right flank of athymic nude mice. At the endpoint (30 days) after injection, mice were euthanized and necropsied. (B) Sox2 expression delayed tumor growth in athymic nude mice. Tumor incidence of HCT116 cells stably expressing mock or Sox2 was analyzed at first measurable tumor growth after injection and compared (*p<0.05, *p<0.01). (C) Sox2 expression suppresses in vivo tumor growth. Average tumor growth of HCT116 cells stably expressing mock or Sox2 was measured and compared. Tumor volume was calculated from measurements of 2 diameters of the individual tumor according to the formula: tumor volume (mm3) = [longer diameter × shorter diameter2]/2 (*p<0.05, *p<0.01). (D) Immunohistofluorescence analysis of tumor tissues. The largest tissues formed from HCT116 cells stably expressing mock or Sox2 were necropsied, fixed in Zamboni’s fixative and tissue slides were prepared. The tissues were hybridized with specific antibodies as indicated and visualized with Cy3 (red color) to detect Sox2 and Cy2 (green color) for detection of ATG10 and ATG8b by laser scanning confocal microscopy (X200; NIKON C1si Confocal Spectral Imaging System, NIKON Instruments Co.).

