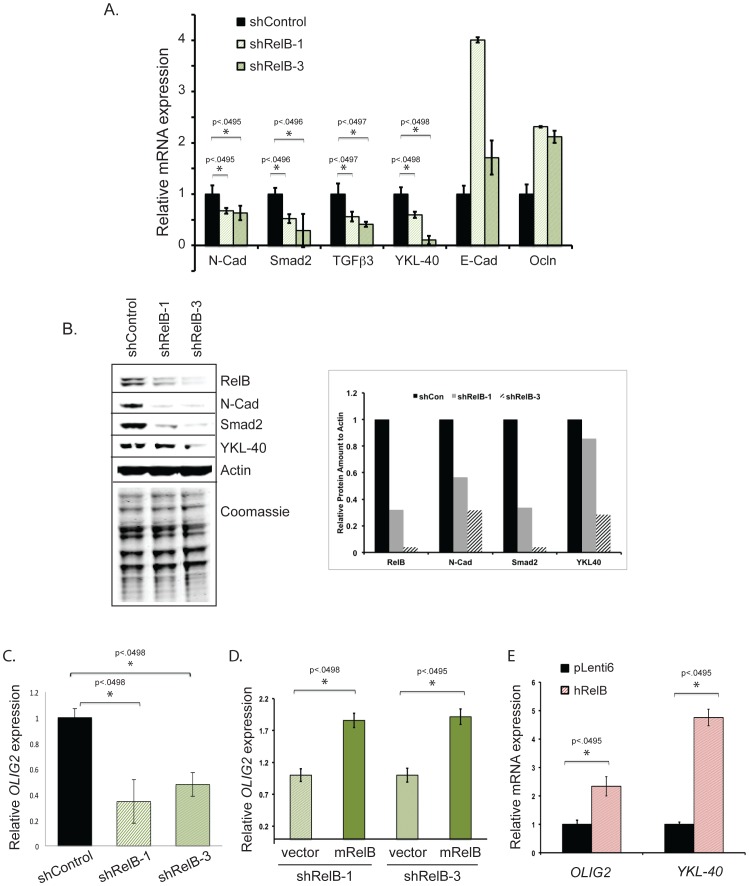
Figure 3. RelB controls the expression of genes associated with EMT.
(A) Quantitative real-time PCR (qRT-PCR) was performed to analyze expression of the indicated mesenchymal and epithelial genes. (B) Western blot analysis with the indicated antibodies was performed on U87 cells expressing control or two independent RelB shRNAs (shRelB-1 and shRelB-3). The accompanying graph shows quantified protein levels in control (shCon) and RelB knockdown cells. (C) qRT-PCR analysis of OLIG2 mRNA levels in shControl and shRelB cells, (D) qRT-PCR analysis of OLIG2 mRNA levels in RelB knockdown cells that contain vector control or rescued mRelB expression. (E) qRT-PCR analysis of OLIG2 and YKL-40 expression in wild type U87 glioma cells that overexpress mRelB.

