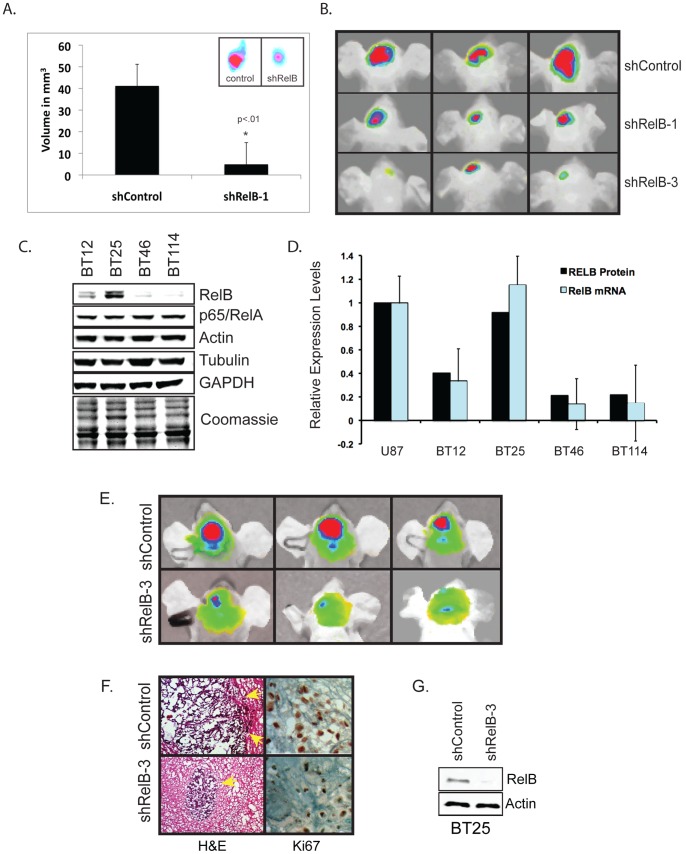
Figure 4. RelB controls tumorigenesis glioma tumorigenesis in vivo and is a prognostic indicator of glioma patient survival.
(A) Subcutaneous xenografts of DiD-labeled U87 shControl and shRelB-1 cells were allowed to grow for 4 weeks (n = 4). Average volume of tumors was determined based on caliper measurement of tumor diameter. Inset shows representative in vivo tumor images taken with an In Vivo Kodak FX Imager. (B) Orthotopic intracranial injection of DiD-labeled U87 shControl, shRelB-1 and shRelB-3 cells were allowed to grow for 4 weeks. Representative in vivo tumor images from one experiment are shown (n = 3). (C) Western blot analysis was performed on patient-derived glioma cells. (D) Comparison of RelB protein and mRNA levels among the indicated cells. To compare RelB protein expression in U87 and BT cells, western blot data from Figs. 1A and 5B were quantified and normalized to Actin. RelB mRNA levels were quantified by real-time PCR. (E) Intracranial tumor growth of DiD-labeled BT25 glioma cells expressing shRNA control or shRNA-RelB-3 was evaluated by in vivo fluorescence imaging 4 weeks after intracranial innoculation. Representative tumor images from one experiment are shown (n = 3). Similar results were seen with shRelB-1 cells (data not shown). (F) H&E and KI67 staining of frozen brain sections after 4 weeks of tumor growth. Yellow arrows indicate tumor borders. (G) Western blot analysis of RelB levels in BT25 shControl and shRelB-3 cells.

