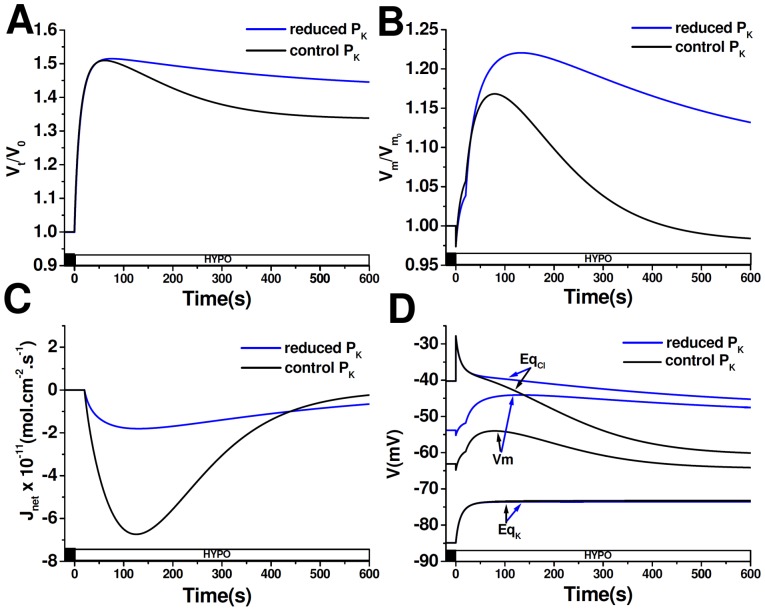
Figure 7. Modeling of cell response to HYPONaCl when PK is reduced.
Time courses of Vt/V0 (A), Vm/Vm0 (B), Jnet (C) and Vm, EqCl, EqK (D) simulated in cells exposed to HYPONaCl. Before the hypoosmotic shock, resting PK was reduced by half and remained constant throughout the entire simulation. At time = 0 extracellular osmolarity was reduced (ΔOsM = 100 mOsM) and after a delay of 20 s, PCl −but not PK− was increased, according to Equation 4. A negative value of J net indicates an outward flux.

