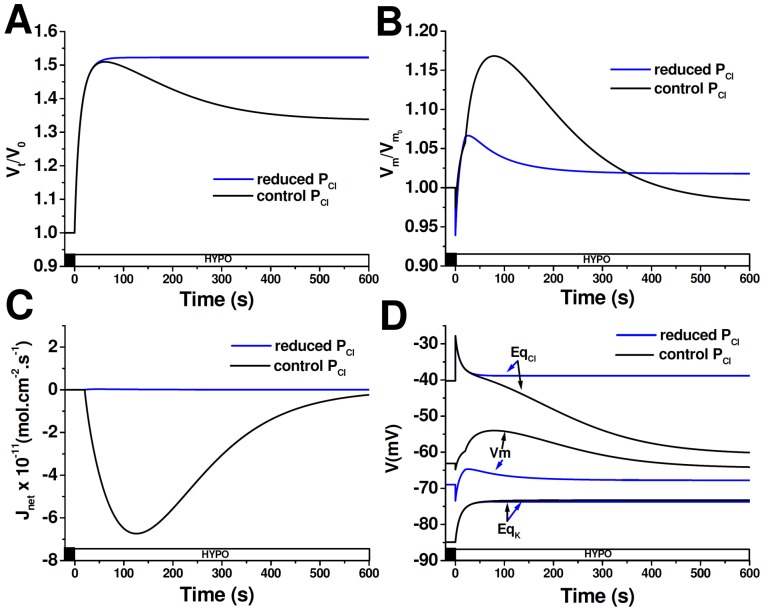
Figure 8. Modeling of cell response to HYPONaCl when PCl is reduced.
Time courses of Vt/V0 (A), Vm/Vm0 (B), Jnet (C) and Vm, EqCl, EqK (D) simulated in cells exposed to HYPONaCl. Before the hypoosmotic shock, resting PCl was reduced a tenfold and remained constant throughout the entire simulation. At time = 0 extracellular osmolarity was reduced (ΔOsM = 100 mOsM) and after a delay of 20 s, PK −but not PCl− was increased, according to Equation 4. A negative value of J net indicates an outward flux.

