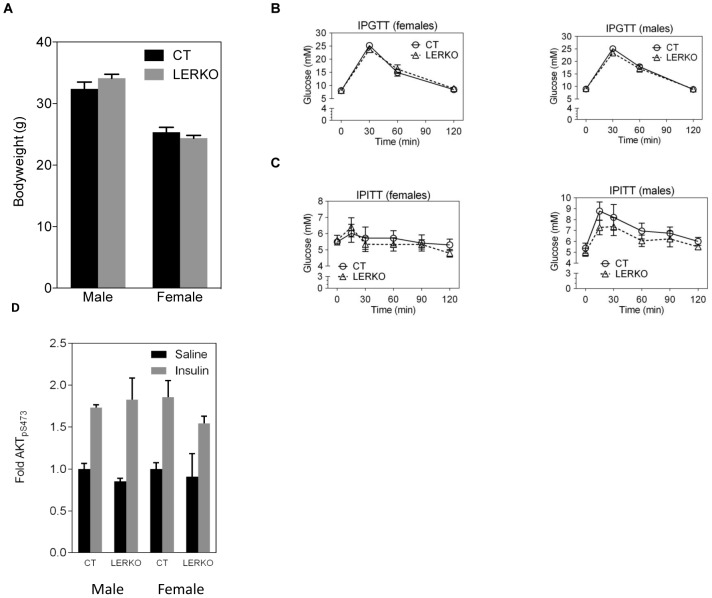
Figure 3. LERKO mice do not exhibit changes in body weight, glucose tolerance and insulin sensitivity.
Body weight of 6 month old male and female LERKO mice was comparable to respective CT mice (A). LERKO and CT mice showed a similar glucose response when assessed by IPGTT (B) or IPITT (C). IPGTT data are represented as a mean ±SD. IPITT data are represented as a mean ±SEM. IPGTT males CT and LERKO n = 8, females CT n = 6, LERKO n = 8; IPITT males CT and LERKO n = 4, females CT and LERKO n = 7. For the IPGTTs and IPITTs we performed additional analyses, calculating the area under the curve. Using this analysis, there was no difference in insulin sensitivity between LERKO and CT mice for males and females (data not shown). Insulin-stimulated AKT phosphorilation in the liver was similar between CT and LERKO mice. Data are represented as a mean±SD. Males CT and LERKO n = 3, females CT and LERKO n = 2–4 (D).

