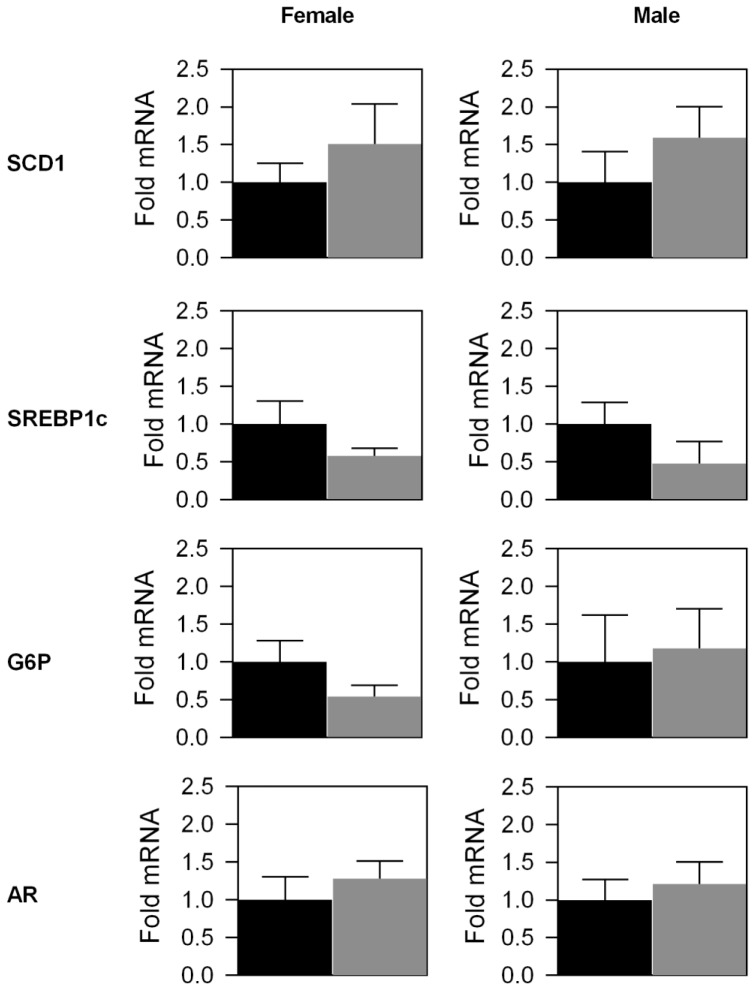
Figure 4. Quantitative PCR analysis of selected hepatic LERKO transcripts.
Selected LERKO and CT liver transcripts were quantitatively analysed using qPCR. Significant changes in transcript levels were not observed for any of the evaluated transcripts. Data are represented as a mean ±SEM of three individual mice. Black bars = CT mice, grey bars = LERKO mice.

