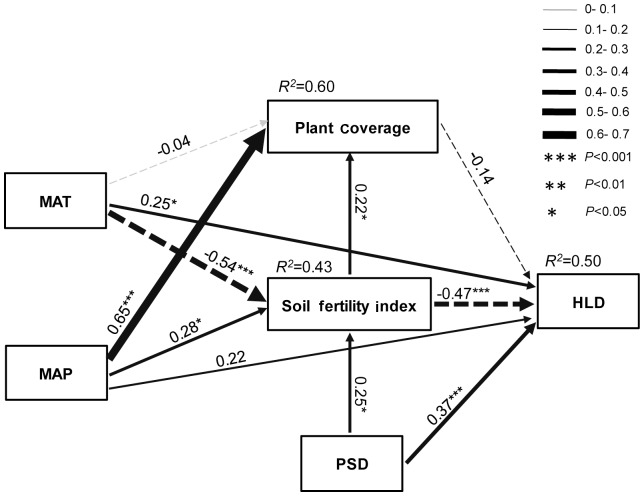
Figure 2. The structural equation model (SEM) showing the hypothesized causal relationships between environmental factors and HLD.
Width of arrows indicates the strength of the standardized path coefficient, solid lines indicate positive path coefficients and dashed lines indicate negative path coefficients, R2 values represent the proportion of variance explained for each endogenous variable. ***P<0.001; **P<0.01; * P<0.05.

