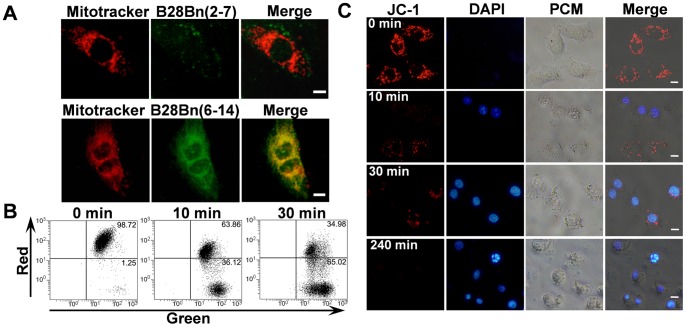
Figure 3. B28Bn(6–14)-induced loss of mitochondrial transmembrane potential. A.
. The mitochondrial localization of B28Bn(6–14) was assessed by co-localization of Mitotracker in DU145 cells. Cells were treated with 5 µM FITC-labeled B28Bn(6–14) for 15–30 min, and the mitochondria was visualized with the red fluorescent probe, Mitotracker CMXRos. B, C. Mitochondrial membrane depolarization in DU145 cells after treatment with 5 µM B28Bn(6–14). Detached cells were stained with JC-1 and subjected to FACS analysis (B). Adherent cells were dual stained with JC-1 and DAPI and observed under fluorescence and phase contrast (PCM) microscopes (C). The decrease of red fluorescence signal revealed the loss of mitochondrial transmembrane potential. Scale bar is 10 µm for all images.

