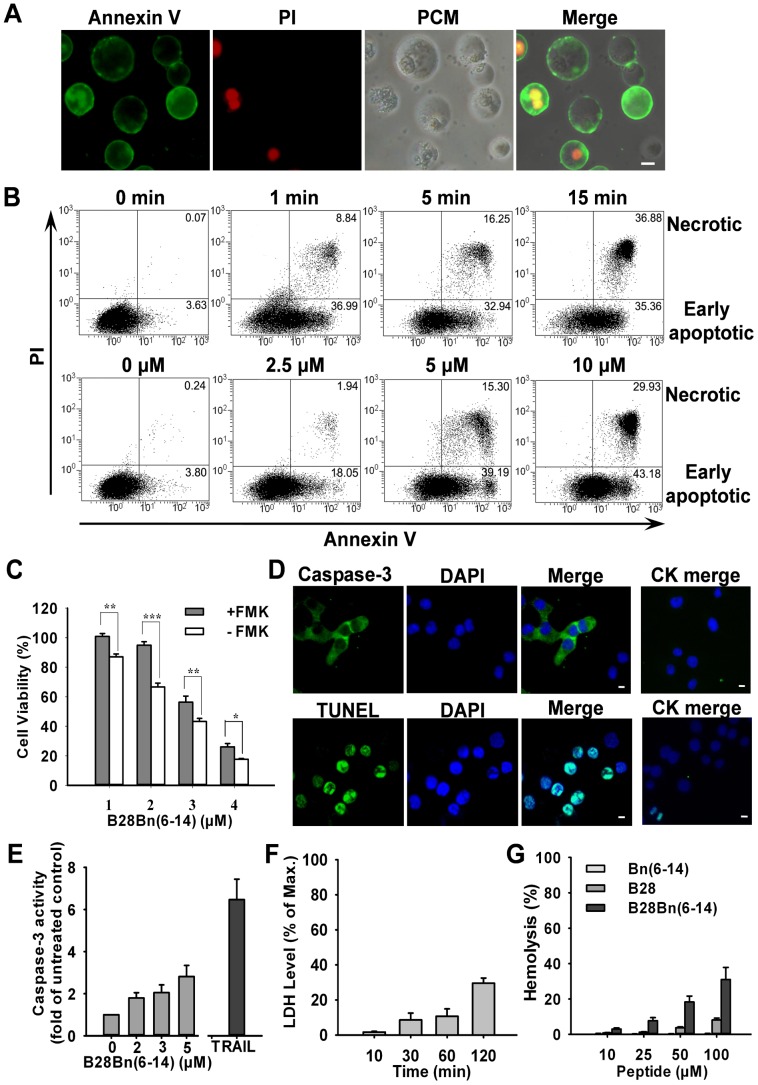
Figure 4. Effect of B28Bn(6–14)-induced apoptosis and necrosis in tumor cells. A.
. Detection of B28Bn(6–14)-induced apoptotic cells under a microscope. Cells treated with B28Bn(6–14) for 30 min were subjected to dual staining with FITC-Annexin V (green) and PI (red). Cells showing Annexin V−/PI-, Annexin V+/PI-, Annexin V+/PI+ were considered living, early apoptotic, and necrotic, respectively, in the merged image (PCM, phase contrast microscope). B. FACS analysis of B28Bn(6–14)-induced apoptosis. DU145 cells were either treated with 5 µM B28Bn(6–14) for different time, or treated with B28Bn(6–14) at different concentrations for 10 min. Cells were stained and analyzed by FACS. Cells in early apoptotic and necrotic stages are indicated as the percentage of total cells counted. C. Inhibition of B28Bn(6–14)-induced apoptosis with the Pan-caspase inhibitor, Z-VAD-FMK. Cells were pre-incubated with Z-VAD-FMK, treated with B28Bn(6–14), and cell viability was determined. *P<0.05, **P<0.01, ***P<0.001, Student’s t test. D. B28Bn(6–14)-induced caspase-3 activation and DNA fragmentation. Cells were treated with B28Bn(6–14) and stained either with the cleaved caspase-3 antibody or the TUNEL kit. Compared with untreated cells (CK merge), the positive cells presented green fluorescence with DAPI-stained nuclei. E. Caspase-3 Colorimetric Assay. Caspase-3 activity was presented as the fold of untreated cells. 2 µg/ml TRAIL was used as the positive control. F. Evaluation of B28Bn(6–14)-induced necrosis. After treatment with 5 µM B28Bn(6–14), the release of lactate dehydrogenase (LDH) into the culture supernatant was detected. LDH levels were presented as the percentage of the max release from the cells treated with 0.9% Triton X-100. G. Assessment of B28Bn(6–14)-induced hemolysis. Human erythrocytes in PBS were treated with the peptide for 16 h. Hemolysis was presented as the percentage of the absorbance at 540 nm from erythrocytes treated with 0.1% Triton X-100. Scale bar is 10 µM for all images.

