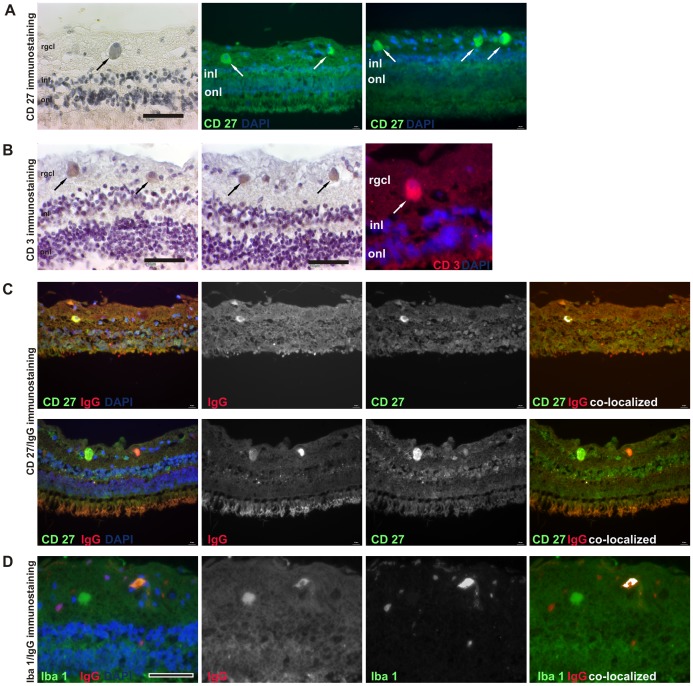
Figure 4. Evidence for B- and T-cells in glaucomatous retina.
After immunodetection with markers against CD27 (panel A) and CD3 (panel B), we detected several CD27+ cells in the rgcl of 4/4 glaucomatous retina as well as few CD3+ cells in one glaucoma subject by brown DAB deposition (indicated by the black arrows, scale bars 50 µm). Positive detection (white arrows, scale bars 10 µm) could be provided by the immunofluorescence approach for both CD markers in the rightmost images, while additional CD20 immunostaining in retina was always negative. Panel C shows the analysis of co-localization of CD27+ and IgG. As indicated in the rightmost images, the co-localized pixels of the individual fluorescence images for CD27 and IgG (middle images) were highlighted in white and identify this cell type clearly as a plasma cell. Furthermore, panel D depicts the co-localization of an IgG deposition in close contact to iba1+ microglia. The interaction between microglia and IgG could be understood functionally in relation to an opsonization. DAPI (blue): nuclei. Scale bars in panel C is 10 µm and in D 50 µm.

