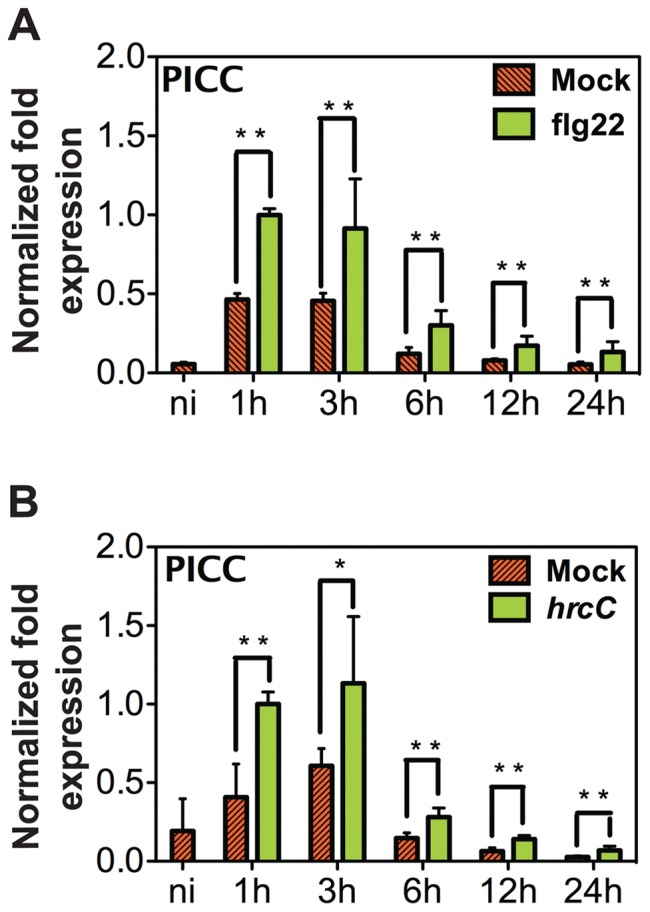
Figure 8. Time course of PICC induction.

4-week-old WT Col-0 plants were infiltrated with 1 µM flg22 (A), or 2×10⁸ CFU ml−1 type III secretion deficient hrcC (B). PICC steady state mRNA levels were quantified by real-time PCR at times indicated. Transcript levels were normalized to ACTIN levels from the same sample. Values are given in arbitrary units with the value in 1 h flg22 treated sample set to 1. Each value is represented as the average of three biological replicates for treatment with flg22 (A) and hrcC (B). Error bars represent one standard deviation. Double (**P<0.01) and single (* P<0.05) asterisks indicate statistically significant difference in values compared to mock treated samples at the corresponding time point.
