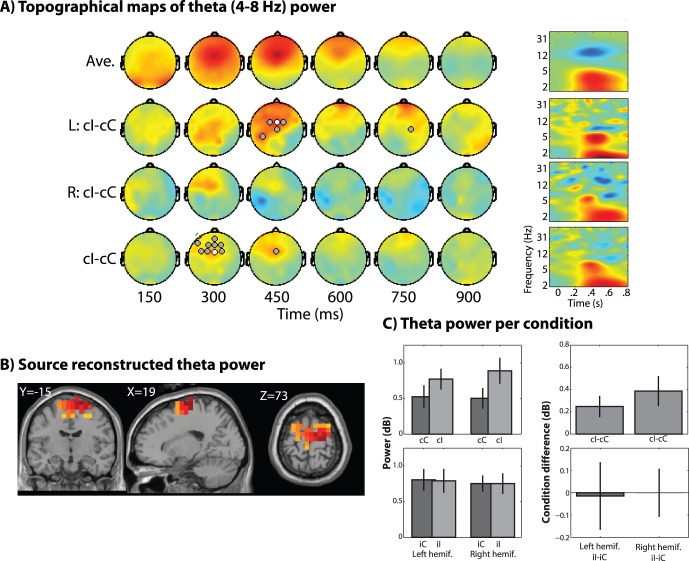
Figure 2. Sensor- and source-level topographical maps of task-related theta band (4–8 Hz) power.
(A) Topographical maps over time (columns) in ms after stimulus onset, averaged across all conditions (top row), for incongruent-congruent trials separately for trials with left hemifield presentation (“L: I-C”) and right hemifield presentation, and for incongruent-congruent trials pooling across both left- and right-hemifield trials. Gray and white circles indicate electrodes in which the condition difference is significant at p<0.00078125 (0.05/64, thus correcting for multiple comparisons across electrodes) and p<0.005 (uncorrected), respectively. Time-frequency plots are from midfrontal electrode FCz. (B) Source-reconstructed theta power from the statistical contrast of all incongruent vs. congruent trials. X, Y, and Z correspond to MNI coordinates of displayed slices. (C) Theta power (in dB relative to pre-stimulus baseline) from all voxels in the region illustrated in panel B plotted separately for each condition and for the “conflict effect” (incongruent minus congruent trials). “hemif.” stands for “hemifield” of stimulus presentation. Top two plots show activity on trials following congruent trials; bottom two plots show activity on trials following incongruent trials. Error bars are standard errors of the mean. Data in B and C are taken from the average of 200 to 600 ms.

