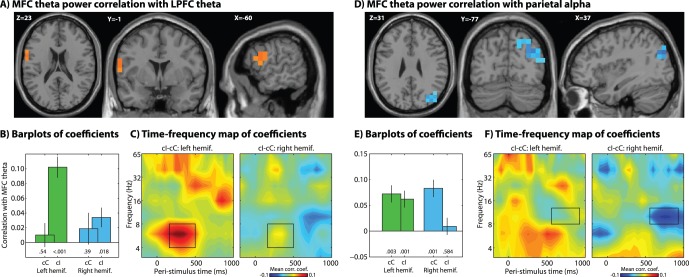
Figure 5. Source-space connectivity analysis seeded from the MFC region exhibiting a significant theta conflict effect (see red blob in Figure 2b ) reveals theta-band connectivity (trial-to-trial power correlations) with left lateral prefrontal cortex.
Bar plots show average correlation coefficients, with error bars reflecting standard errors of the mean, across subjects. Numbers under bars indicate p-values of correlation coefficients of each condition, tested across subjects against zero. Note that the contrast was defined as stronger correlations for incongruent compared to congruent trials, pooling across both left- and right-hemifield conditions.

