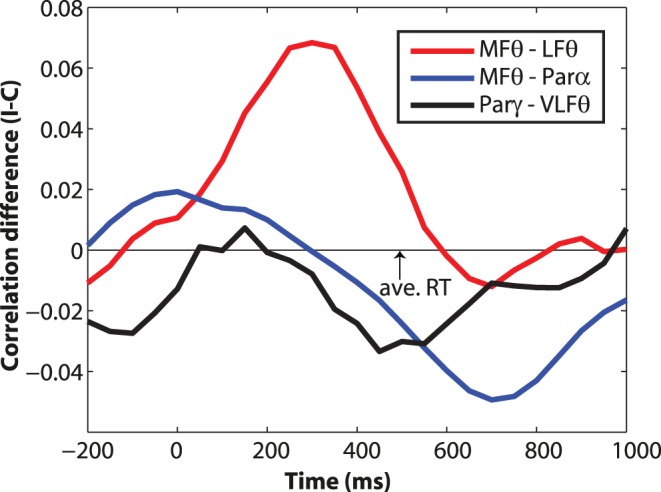
Figure 7. Connectivity time courses reveal dynamics of conflict-induced network shifts.

Y-axis shows the difference in correlation coefficients for incongruent minus congruent trials (averaging across left- and right-hemifield trials; positive numbers indicate stronger coupling during incongruent trials, and negative numbers indicate stronger coupling during congruent trials).  = connectivity between medial frontal theta and lateral frontal theta, see Figure 5a–c;
  = connectivity between medial frontal theta and parietal alpha, see Figure 5d–f;
  = connectivity between parietal gamma and ventrolateral frontal theta, see Figure 6.
