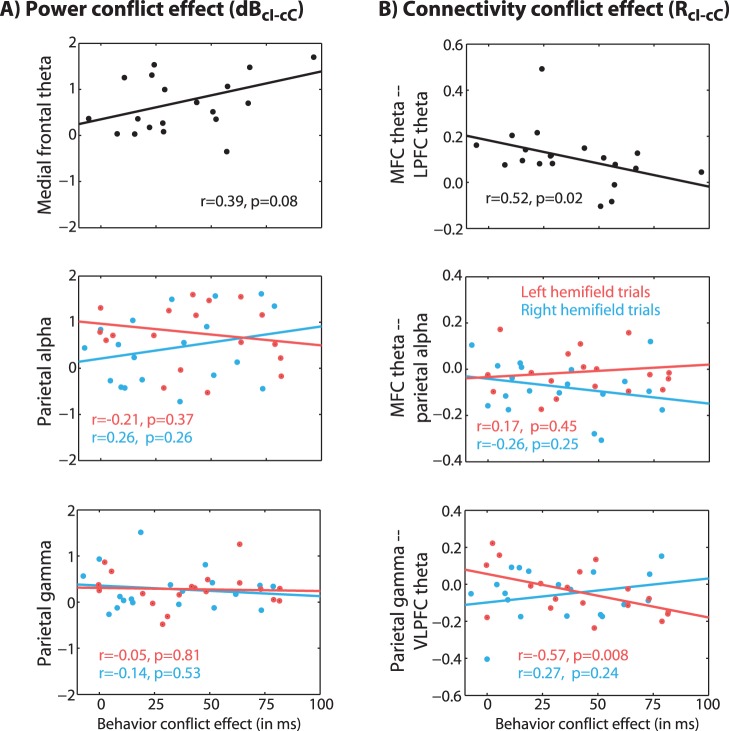
Figure 8. Correlations between brain conflict effects (localized band-specific power in A and network connectivity in B) and the behavior conflict effect.
Brain data reflect the same time-frequency-space windows as used in previous figures; behavior conflict effect refers to individual differences in cI-cC RTs. Results show that subjects with stronger MFC-LFC theta networks, and subjects with stronger right parietal gamma-VLPFC theta networks, expressed less conflict at the behavioral level. Data are collapsed across left- and right-hemifield trials for MFC data (top row), because brain effects showed no laterality.

