
Figure 5. Effect of mutating the tubulin-binding site on AT1R export from the ER.
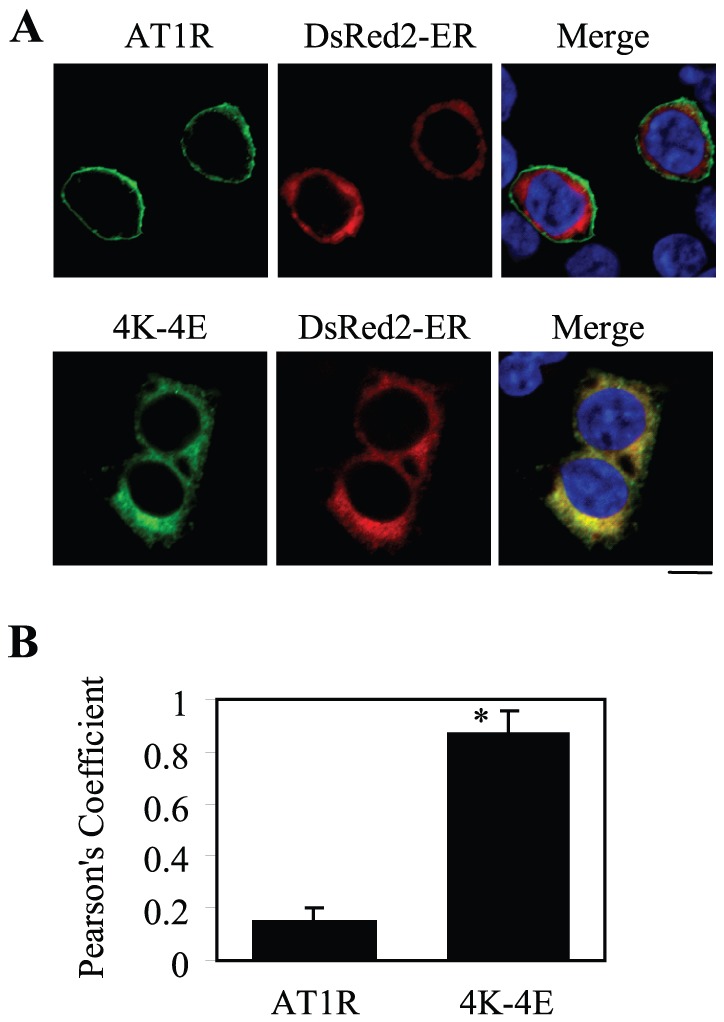
(A) Co-localization of AT1R and its mutant 4K–4E with the ER marker DsRed2-ER. HEK293 cells cultured on coverslips were transfected with GFP-tagged AT1R or its mutant 4K–4E together with pDsRed2-ER. Co-localization of AT1R and 4K–4E with DsRed2-ER was revealed by fluorescence microscopy. Green, GFP-tagged AT1R; red, the ER marker DsRedER-2; yellow, co-localization of AT1R with the ER marker; blue, DNA staining by 4,6-diamidino-2-phenylindole (nuclei). The data shown are representative images of at least four independent experiments. (B) Quantification of Pearson’s coefficient between the receptors and the ER marker. The data are presented as the mean ± S.E. of 60 cells from four different experiments. *, p < 0.05 versus wild-type AT1R. Scale bar, 10 µm.