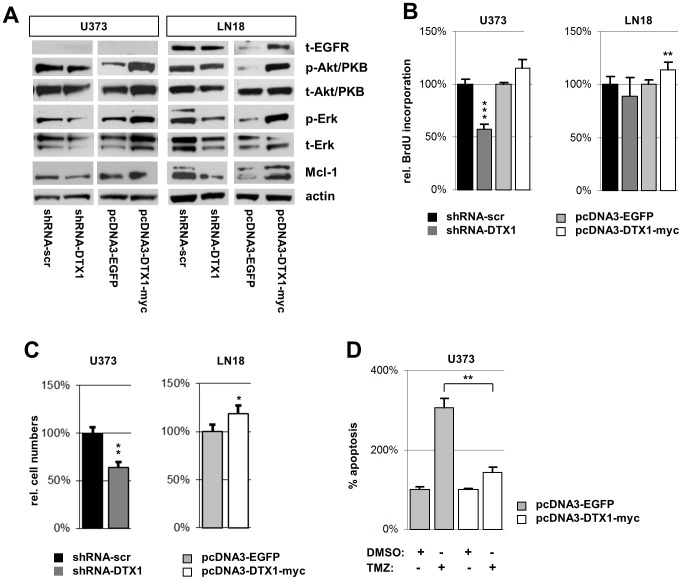
Figure 2. Proliferation and mitotic signaling pathways are modified by DTX1 in established glioma cell lines.
(A) Western blot analysis of signaling cascade proteins. Blots for total EGFR (t-EGFR), phosphorylated Akt/PKB (p-Akt/PKB), total Akt/PKB (t-Akt/PKB), phosphorylated Erk (p-Erk), total Erk (t-Erk), Mcl-1 and β-actin (actin) are shown. (B) Proliferation analysis by BrdU incorporation assay. Relative average values of 5 individual experiments are shown per genotype. (C) Proliferation analysis by cell counting. Equal numbers of cells were seeded, grown for 3d under standard conditions and counted afterwards. (D) Apoptosis in U373 cells after treatment with 100 µM temozolomide (TMZ) or DMSO control. Relative values of sub-G1 cells measured by PI staining are shown normalized to control cells treated with vector control. Averages of at least three independent experiments are shown. Values are normalized to controls. Error bars: ±SEM. * p<0.05, ** p<0.01, *** p<0.001.

